An empirical analysis of water temperature
advertisement

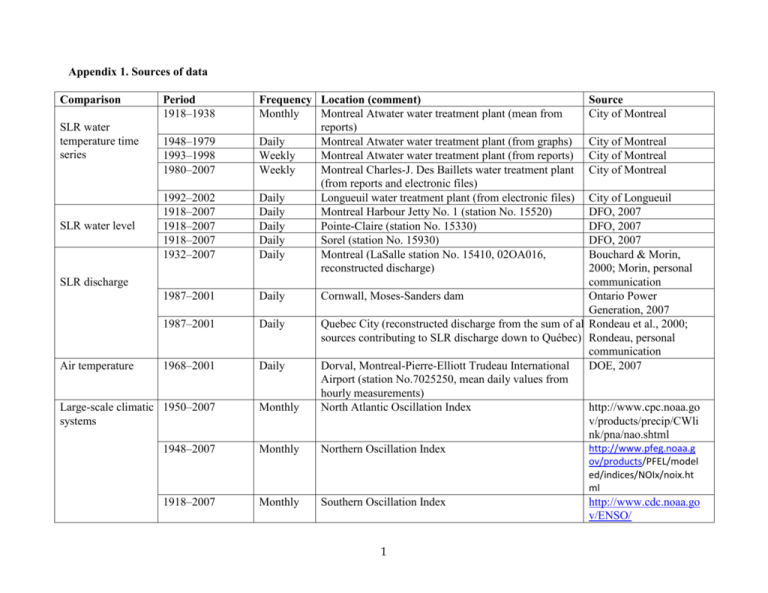
Appendix 1. Sources of data Comparison SLR water temperature time series SLR water level Period 1918–1938 1948–1979 1993–1998 1980–2007 1992–2002 1918–2007 1918–2007 1918–2007 1932–2007 Frequency Location (comment) Monthly Montreal Atwater water treatment plant (mean from reports) Daily Montreal Atwater water treatment plant (from graphs) Weekly Montreal Atwater water treatment plant (from reports) Weekly Montreal Charles-J. Des Baillets water treatment plant (from reports and electronic files) Daily Longueuil water treatment plant (from electronic files) Daily Montreal Harbour Jetty No. 1 (station No. 15520) Daily Pointe-Claire (station No. 15330) Daily Sorel (station No. 15930) Daily Montreal (LaSalle station No. 15410, 02OA016, reconstructed discharge) SLR discharge Air temperature 1987–2001 Daily 1987–2001 Daily 1968–2001 Daily Large-scale climatic 1950–2007 systems Monthly 1948–2007 Monthly Source City of Montreal City of Montreal City of Montreal City of Montreal City of Longueuil DFO, 2007 DFO, 2007 DFO, 2007 Bouchard & Morin, 2000; Morin, personal communication Cornwall, Moses-Sanders dam Ontario Power Generation, 2007 Quebec City (reconstructed discharge from the sum of all Rondeau et al., 2000; sources contributing to SLR discharge down to Québec) Rondeau, personal communication Dorval, Montreal-Pierre-Elliott Trudeau International DOE, 2007 Airport (station No.7025250, mean daily values from hourly measurements) North Atlantic Oscillation Index http://www.cpc.noaa.go v/products/precip/CWli nk/pna/nao.shtml http://www.pfeg.noaa.g Northern Oscillation Index ov/products/PFEL/model ed/indices/NOIx/noix.ht ml 1918–2007 Monthly Southern Oscillation Index 1 http://www.cdc.noaa.go v/ENSO/ Warm: 1953, 1975, Daily Warm and cool years 1995, 1998, 1999 in SLR 2001 Cool: 1950, 1951, 1963, 1972, 1976, 1978 Longitudinal 1987–2001 Daily variations in water temperature in the 2001 Daily SLR water mass 2001 Daily 1987–2001 Daily Transversal gradients 1994 Weekly of water temperature and conductivity 2004 Monthly to identify water mass Thermal budget 1992–2001 Daily of fish residing 1992–2001 Daily or migrating between water masses Pike YCSI 1968–1976 Yearly 1991–2001 Years when mean water temperature was ≥ 1 s.d. either City of Montreal above (“warm years”) or below (“cool years”) the 1919– City of Longueuil 2007 mean, and for which daily water temperature measurements were available, for Montreal-area treatment plants (Atwater or Longueuil) km 0 - Cornwall, Moses-Saunders dam Ontario Power Generation, 2007 km 125 - Longueuil treatment plant City of Longueuil km 235 - Trois-Rivières buoy C-65 DFO, 2003 km 360 - Sainte-Foy treatment plant City of Québec River cross-section in narrow corridor between Hudon, 2000; Hudon, Repentigny and Varennes (10 stations) unpubl. data River cross-section in wide fluvial Lake Saint-Pierre Hudon & Carignan, (Transect No. 5, 18 stations) 2008; Hudon, unpubl. data Longueuil treatment plant (SLR water mass) City of Longueuil Pointe-Claire treatment plant (for the Ottawa River City of Pointe-Claire water mass) Yellow perch YCSI 1982–1989 1991–1998 Carp mortality during May–June spawning in 2001 2001 Environmental variables May–June inducing carp 2001 mortality during spawning Index of year-class strength for yellow perch (Lake Saint-Pierre) Observations and reports of live and dead carp in SLR Yearly Index of year-class strength for Pike in SLR (Iles de Boucherville, Rivière aux Pins, Lake Saint-Pierre) Casual observations Every 15 Air temperature at Lake Saint-Pierre minutes Water temperature in a wetland and in the navigation channel in Lake Saint-Pierre Hourly Water level at Lake Saint-Pierre (Curve No. 2, station No. 15975) 2 Massé et al., 1991, Armellin & Méthot, 2004 Mailhot & Dumont, 2003 Mingelbier et al., 2001 Hudon, unpubl. data Hudon, unpubl. data DFO, 2007


