COD - CHOOSE YOUR PARENTS WITH CARE! Growth differences
advertisement
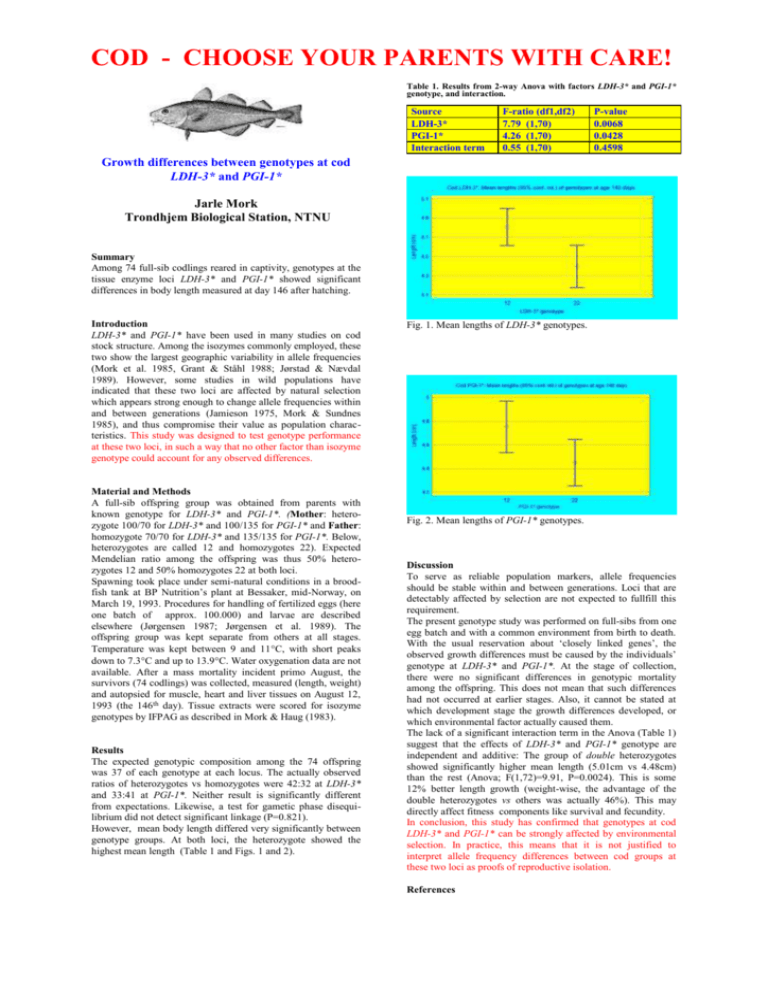
COD - CHOOSE YOUR PARENTS WITH CARE! Table 1. Results from 2-way Anova with factors LDH-3* and PGI-1* genotype, and interaction. Source LDH-3* PGI-1* Interaction term F-ratio (df1,df2) 7.79 (1,70) 4.26 (1,70) 0.55 (1,70) P-value 0.0068 0.0428 0.4598 Growth differences between genotypes at cod LDH-3* and PGI-1* Jarle Mork Trondhjem Biological Station, NTNU Summary Among 74 full-sib codlings reared in captivity, genotypes at the tissue enzyme loci LDH-3* and PGI-1* showed significant differences in body length measured at day 146 after hatching. Introduction LDH-3* and PGI-1* have been used in many studies on cod stock structure. Among the isozymes commonly employed, these two show the largest geographic variability in allele frequencies (Mork et al. 1985, Grant & Ståhl 1988; Jørstad & Nævdal 1989). However, some studies in wild populations have indicated that these two loci are affected by natural selection which appears strong enough to change allele frequencies within and between generations (Jamieson 1975, Mork & Sundnes 1985), and thus compromise their value as population characteristics. This study was designed to test genotype performance at these two loci, in such a way that no other factor than isozyme genotype could account for any observed differences. Material and Methods A full-sib offspring group was obtained from parents with known genotype for LDH-3* and PGI-1*. (Mother: heterozygote 100/70 for LDH-3* and 100/135 for PGI-1* and Father: homozygote 70/70 for LDH-3* and 135/135 for PGI-1*. Below, heterozygotes are called 12 and homozygotes 22). Expected Mendelian ratio among the offspring was thus 50% heterozygotes 12 and 50% homozygotes 22 at both loci. Spawning took place under semi-natural conditions in a broodfish tank at BP Nutrition’s plant at Bessaker, mid-Norway, on March 19, 1993. Procedures for handling of fertilized eggs (here one batch of approx. 100.000) and larvae are described elsewhere (Jørgensen 1987; Jørgensen et al. 1989). The offspring group was kept separate from others at all stages. Temperature was kept between 9 and 11C, with short peaks down to 7.3C and up to 13.9C. Water oxygenation data are not available. After a mass mortality incident primo August, the survivors (74 codlings) was collected, measured (length, weight) and autopsied for muscle, heart and liver tissues on August 12, 1993 (the 146th day). Tissue extracts were scored for isozyme genotypes by IFPAG as described in Mork & Haug (1983). Results The expected genotypic composition among the 74 offspring was 37 of each genotype at each locus. The actually observed ratios of heterozygotes vs homozygotes were 42:32 at LDH-3* and 33:41 at PGI-1*. Neither result is significantly different from expectations. Likewise, a test for gametic phase disequilibrium did not detect significant linkage (P=0.821). However, mean body length differed very significantly between genotype groups. At both loci, the heterozygote showed the highest mean length (Table 1 and Figs. 1 and 2). Fig. 1. Mean lengths of LDH-3* genotypes. Fig. 2. Mean lengths of PGI-1* genotypes. Discussion To serve as reliable population markers, allele frequencies should be stable within and between generations. Loci that are detectably affected by selection are not expected to fullfill this requirement. The present genotype study was performed on full-sibs from one egg batch and with a common environment from birth to death. With the usual reservation about ‘closely linked genes’, the observed growth differences must be caused by the individuals’ genotype at LDH-3* and PGI-1*. At the stage of collection, there were no significant differences in genotypic mortality among the offspring. This does not mean that such differences had not occurred at earlier stages. Also, it cannot be stated at which development stage the growth differences developed, or which environmental factor actually caused them. The lack of a significant interaction term in the Anova (Table 1) suggest that the effects of LDH-3* and PGI-1* genotype are independent and additive: The group of double heterozygotes showed significantly higher mean length (5.01cm vs 4.48cm) than the rest (Anova; F(1,72)=9.91, P=0.0024). This is some 12% better length growth (weight-wise, the advantage of the double heterozygotes vs others was actually 46%). This may directly affect fitness components like survival and fecundity. In conclusion, this study has confirmed that genotypes at cod LDH-3* and PGI-1* can be strongly affected by environmental selection. In practice, this means that it is not justified to interpret allele frequency differences between cod groups at these two loci as proofs of reproductive isolation. References COD - CHOOSE YOUR PARENTS WITH CARE! Grant, W.S., & Ståhl, G. 1988. Evolution of Atlantic and Pacific cod: loss of genetic variation and gene expression in Pacific cod. Evolution 42: 138-146. Jamieson, A. 1975. Protein types of Atlantic cod on the North American Banks. P 491-515. In: C.L. Markert (ed.) Isozymes IV. Genetics and Evolution. Acad. Press. New York. Jørgensen, L. 1987. An automated system for incubation of pelagic fish eggs. Mod. Ident. Contr. 8(1): 47-50. Jørgensen, L., Olsen, Y. & Rosenlund, G. 1989. Intensive rearing of juvenile cod (Gadus morhua). 3rd Int. Symp. On Feeding and Nutr. In Fish. Toba, Japan. Jørstad, K. & Nævdal, G. 1989. Genetic variation and population structure of cod, Gadus morhua L., in some fjords in northern Norway. J. Fish. Biol. 35: 245-252. Mork, J. & Haug, T. 1983. Genetic variation in halibut Hippoglossus hippoglossus (L.) from Norwegian waters. Hereditas 98: 167-174. Mork, J. & Sundnes, G. 1985. O-group cod in captivity: Differential survival of certain genotypes. Helgolander Meeresunters. 39: 63-70. Mork, J., Ryman,. N., Ståhl, G., Utter, F. & Sundnes, G. 1985. Genetic variation in Atlantic cod (Gadus morhua) throughout its range. Can. J. Fish Aquat. Sci. 42(10): 1580-1587.
