AERMOD
advertisement
AERMOD
Overview
In 1991, the American Meteorological Society (AMS) and the US Environmental Protection
Agency (EPA) initiated a formal collaboration with the designed goal of introducing current
planetary boundary layer (PBL) concepts into regulatory dispersion model. A working group
(AMS/EPA Regulatory Model Improvement Committee, AERMIC) comprised of AMS and EPA
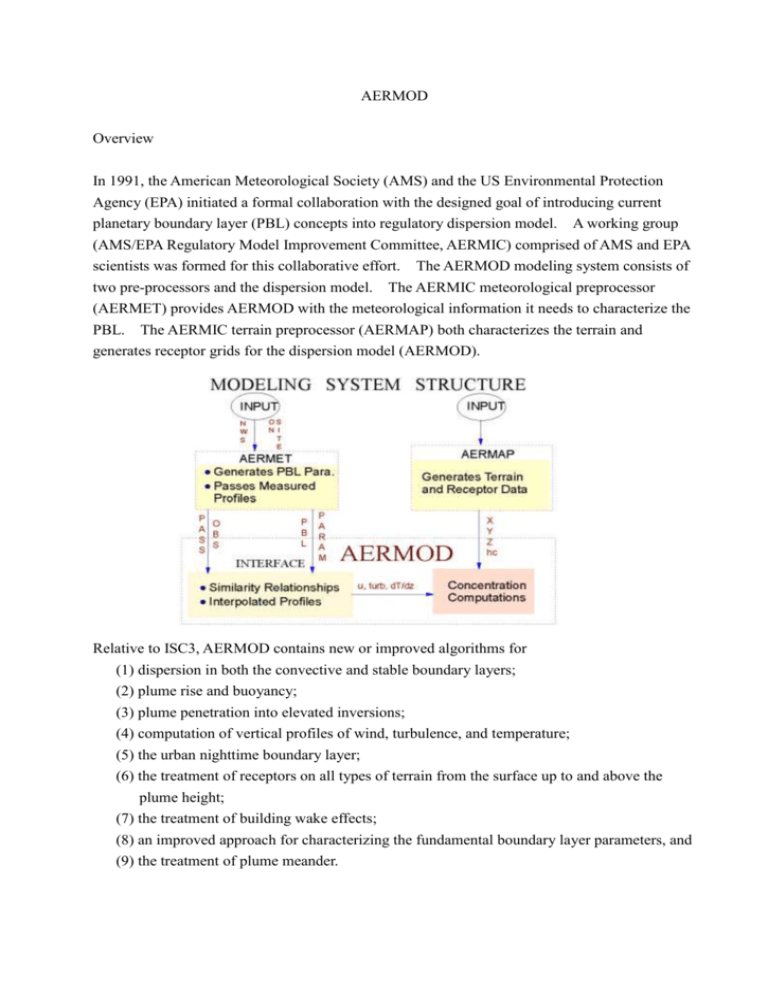
scientists was formed for this collaborative effort. The AERMOD modeling system consists of
two pre-processors and the dispersion model. The AERMIC meteorological preprocessor
(AERMET) provides AERMOD with the meteorological information it needs to characterize the
PBL. The AERMIC terrain preprocessor (AERMAP) both characterizes the terrain and
generates receptor grids for the dispersion model (AERMOD).
Relative to ISC3, AERMOD contains new or improved algorithms for
(1) dispersion in both the convective and stable boundary layers;
(2) plume rise and buoyancy;
(3) plume penetration into elevated inversions;
(4) computation of vertical profiles of wind, turbulence, and temperature;
(5) the urban nighttime boundary layer;
(6) the treatment of receptors on all types of terrain from the surface up to and above the
plume height;
(7) the treatment of building wake effects;
(8) an improved approach for characterizing the fundamental boundary layer parameters, and
(9) the treatment of plume meander.
AERMOD is a steady state plume model in that it assumes the concentrations at all distances
during a modeled hour are governed by the temporally averaged meteorology of the hour. In the
convective boundary layer (CBL), the horizontal distribution is also assumed to be Gaussian, but
the vertical distribution is described with a bi-Gaussian probability density function. Using a
relatively simple approach, AERMOD incorporates current concepts about flow and dispersion
in complex terrain. Where approximate the plume is modeled as either impacting and/or
following the terrain. All terrain is handled in a consistent and continuous manner while
considering the dividing streamline concept in stably-stratified conditions. One of the major
improvements that AERMOD brings to the applied dispersion modeling is its ability to
characterize the PBL through both surface and mixed layer scaling. AERMOD constructs
vertical profiles of required meteorological variables based on measurements and extrapolations
of those measurements using similarity (scaling) relationships.
Surface characteristics in the form of albedo, surface roughness and Bowen ratio, plus standard
meteorological observations (wind speed, wind direction, temperature, and cloud coverage), are
input to AERMET. AERMET then calculates the PBL parameters: friction velocity,
Monin-Obukhov length, convective velocity scale, temperature scale, mixing height, and surface
heat flux. These parameters are then passed to the INTERFACE (which is within AERMOD)
where similarity expressions (in conjunction with measurements) are used to calculate vertical
profiles of wind speed (u), lateral and vertical turbulent fluctuations ( v , w ), potential
temperature ( ), and potential temperature gradient ( d / dz ). The AERMIC terrain
preprocessor AERMAP uses gridded terrain data to calculate a representative terrain-influence
height (hc), also referred to as the terrain height scale. The terrain height scale hc, which is
uniquely defined for each receptor location, is used to calculate the dividing streamline height.
For each receptor, AERMAP passes the following information to AERMOD: the receptor’s
location (xr, yr), its height above mean sea level (zr), and the receptor specific terrain height scale
(hc).
The AMS/EPA Regulatory Model AERMOD
The general form of the expressions for concentration for both the CBL and SBL is given as:
C ( x, y , z )
Q
Py { y; x}Pz {z; x}
u
where Q is the source emission rate, u is the effective wind speed, and Py and Pz are the
probability density functions (pdf) for the lateral and vertical concentration distributions,
respectively. AERMOD assumes a traditional Gaussian pdf for both the lateral and vertical
distributions in the SBL and for the lateral distribution in the CBL. The CBL’s vertical
distribution of plume reflects the distinctly non-Gaussian distribution of the vertical velocity
distribution in convectively mixed layers.
A. General Structure of AERMOD Including Terrain
AERMOD is a steady state plume model. In the stable boundary layer (SBL), it assumes the
concentration distribution to be Gaussian in both the vertical and horizontal directions. In the
convective boundary layer (CBL), the horizontal distribution is also assumed to be Gaussian, but
the vertical distribution is described with a bi-Gaussian probability density function.
AERMOD Two State Approach: The total concentration predicted by AERMOD is the weighted
sum of the two extreme possible plume states.
In complex terrain, AERMOD incorporates the concept of the dividing streamline for
stably-stratified conditions. The plume is modeled as a combination of two limiting cases: a
horizontal plume (terrain impacting) and a terrain-following plume (terrain responding). That
is, AERMOD handles the computation of pollutant impacts in both flat and complex terrain
within the same modeling framework. Generally, in stable flows, a two-layer structure develops
in which the lower layer remains horizontal while the upper layer tends to rise over the terrain.
In neutral and unstable conditions, the dividing streamline height H c 0 . A plume embedded
in the flow below Hc tends to remain horizontal; it might go around the hill or impact on it. A
plume above Hc will ride over the hill. The AERMOD terrain preprocessor (AERMAP) uses
gridded terrain data to calculate a representative terrain- influence height (hc) for each receptor
with which AERMOD computes receptor specific Hc values. The general concentration
equation, which applies in stable or convective conditions is given as
CT ( xr , yr , zr ) ( f )Cc , s ( xr , yr , zr ) (1 f )Cc , s ( xr , yr , z p )
where CT(xr, yr, zr) is the total concentration, Cc,s(xr, yr, zr) is the contribution from the
horizontal plume state (subscripts c and s refer to convective and stable conditions, respectively),
Cc,s(xr, yr, zp) is the contribution from terrain-following state, f is the plume state weighting
function, (xr, yr, zr) is the coordinate representation of a receptor (with zr defined relative to stack
base elevation, z p zr zt is the height of a receptor above local ground, and zt is the terrain
height at a receptor. Note that in flat terrain, zt 0 , z p zr , and the concentration reduces to
the form for a single horizontal plume. It is important to note that for any concentration
calculation all heights are referenced to stack base elevation.
Hc
C ( x , y , z )dz
s
The fraction of the plume mass below Hc (that is, p ) is computed as: p
r
r
r
0
C ( x , y , z )dz
s
r
r
r
0
where Cs ( xr , yr , zr ) is the concentration in the absence of the hill for the stable conditions. In
convective conditions, H c 0 and p 0 . The plume state weighting factor f is given as
f 0.5(1 p ) . When the plume is entirely below Hc ( p 1.0 and f 1.0 ), the concentration
is determined only the horizontal plume. When the plume is entirely above the critical dividing
streamline height or when the atmosphere is either neutral or convective, p 0 and f 0.5 .
Therefore, during convective conditions the concentration at an elevated receptor is simply the
average of the contributions from the two states.
states are equal and are equally weighted.
For flat terrain, the contributions from the two
Treatment of Terrain in AERMOD: Construction of the weighting factor used in calculating total
concentration.
B. Concentration Predictions in the CBL
In AERMOD, the dispersion formulation for the convective boundary layer represents one of the
more significant model advances by comparison with existing regulatory models. One assumes
that plume sections are emitted into a traveling train of convective elements - updrafts and
downdrafts – that move with the mean wind. The vertical and lateral velocities in each element
are assumed to be random variables and characterized by their probability density functions. In
the CBL, the pdf of the vertical velocity is positively skewed and results in a non-Gaussian
vertical concentration distribution, Fz. The positive skewness is consistent with higher
frequency of occurrence of downdrafts than updraft; for an elevated non-buoyant source the
skewness also leads to the decent of the plume centerline. Notice that since a larger percentage
of the instantaneous plume is affected by downdrafts, the ensemble average has a general
downward trend. Since downdrafts are more prevalent the average velocity of the downdrafts
as correspondingly weaker than the average updraft velocity to insure that mass is conserved.
Instantaneous and corresponding ensemble-averaged plume in the CBL
In AERMOD, a skewed vertical velocity pdf, pw, is modeled using a bi-Gaussian distribution
as
pw
( w w1 ) 2
( w w2 ) 2
1
2
exp
exp
2
2
2
2 w 2
2 w1
2
w1
w2
where 1 and 2 are weighting coefficients for the two distributions with 1 2 1 (the
subscripts 1 and 2 refer to the updraft and downdraft distributions, respectively). The
parameters of the pdf ( w1 , w2 , w1 , w2 , 1 , 2 ) are functions of w (the total or overall root mean
3
3
square vertical turbulent velocity), the vertical velocity skewness S w / w (where w is
3
the third moment of w), and a parameter R w1 / w1 w2 / w2 2 .
The instantaneous plume is assumed to have a Gaussian concentration distribution about its
randomly varying centerline. The mean or average concentration is found by summing the
concentrations due to all of the random centerline displacements. The averaging process results
in a skewed distribution which AERMOD represents as a bi-Gaussian approach to approximate
the skewed vertical concentration distribution in the CBL. The following figure shows two
mean trajectories, each representing the average of many individual trajectories of parcels (or
particles) released into downdraft (the downdraft plume) or updrafts (the updraft plume). The
velocities determining these mean trajectories include the mean horizontal wind speed (u), the
vertical velocity due to plume buoyancy (vbuoy), and the mean updraft ( w1 ) or downdraft ( w2 )
velocity.
AERMOD’s pdf approach for plume dispersion in the CBL: AERMOD approximates the skewed
distribution by superimposing two Gaussian distributions, the updraft and downdraft
distributions.
AERMOD simulates five different plume types depending on the atmospheric stability and on
the location in and above the boundary layer: direct, indirect, penetrated, injected, and stable.
During stable conditions, plume are modeled with the familiar horizontal and vertical Gaussian
formulations. During convective conditions ( L 0 ), the horizontal distribution is still Gaussian;
the vertical concentration distribution results from a combination of three plume types:
(1) the direct plume material within the mixed layer that initially does not interact with the
mixer layer lid;
(2) the indirect plume material within the mixed layer that rises up and tends to initially loft
near the mixed layer top; and
(3) the penetrates plume material that is released in the mixed layer but, due to its buoyancy,
penetrates into the elevated stable layer.
During convective conditions, AERMOD also handles injected source where the stack top (or
release height) is greater than the mixing height. Injected sources are modeled as plumes in
stable conditions, however the influence of the turbulence and the winds within the mixed layer
are considered in the inhomogeneity calculations as the plume material passes through the mixed
layer to reach receptors.
AERMOD’s three plume treatment of the CBL
The above figure illustrates the three plume approach used in AERMOD’s convective model.
In AERMOD, the total concentration in the CBL is obtained by summing the contribution from
the three sources. For the horizontal plume state, the total concentration, Cc, is given as:
Cc ( xr , yr , zr ) Cd ( xr , yr , zr ) Cr ( xr , yr , zr ) C p ( xr , yr , zr )
where Cd, Cr, and Cp are the contributions from the direct, indirect, and penetrated sources,
respectively. The total concentration for the terrain-following state has the same form but with
zr replaced by zp.
The fraction of fp of the source material that remains trapped in the CBL is given by
f p 0 if hh 0.5heq ; f p 1 if hh 1.5heq ; and
fp
hh
0.5 if 0.5heq hh 1.5heq
h eq
where hh zi hs and heq is the equilibrium plume rise in a stable environment and is
3
2
given as heq 2.63 Ps
3
1/ 3
hh and Ps
Fb
is the penetration parameter,
2
3
uN h hh
g
T
Fb gws rs
is the stack buoyancy flux, and N h
Ts
( zi ) z
2
z zi
1/ 2
is the Brunt-Vaisala
frequency, u is the wind speed at stack height, g is the gravitational acceleration, ws, rs, and Ts are
the stack exit velocity, radius, and temperature, respectively, and is the ambient potential
temperature.
I. Direct source contribution to concentration in the CBL, Cd ( xr , yr , z )
Cd ( xr , yr , z )
Py j
2 u j 1 m0 zj
Qf p
2
( z dj 2mzi )2
( z dj 2mzi )2
exp
exp
2
2
2 zj
2 zj
where fp is the fraction of fraction of the plume mass trapped in the CBL ( 0 f p 1 ), u is the
wind speed at stack top, Py
y2
epx
is the lateral distribution function,
2 2
2 y
y
1
wjx
and zj are the effective source height and vertical dispersion parameter
u
corresponding to each of the two vertical velocity distributions, as shown in previous section.
dj hs hd
The subscript j is equal to 1 for updrafts and 2 for downdrafts. The lateral and vertical
dispersion parameters ( y and zj ) are computed from the combined effects of ambient,
buoyancy-induced, and building-induced turbulence.
II. Indirect source contribution to concentration in the CBL, Cr ( xr , yr , z)
Cr ( xr , yr , z )
Py j
2 u j 1 m1 zj
Qf p
2
( z rj 2mzi )2
( z rj 2mzi )2
exp
exp
2
2
2
2
zj
zj
where and z is equal to either zr for the horizontal plume state or zp for the terrain-following state.
III. Penetrated source contribution to concentration in the CBL, C p ( xr , yr , z )
( z hep 2mzieff ) 2
( z hep 2mzieff ) 2
C p ( xr , yr , z )
Py exp
exp
2
2
2 zp
2 zp
2 u zp m
Q(1 f p )
where zieff is the height of the upper reflecting surface in a stable layer and z is equal to either zr
for the horizontal plume state or zp for the terrain-following state. The penetrated plume height
hep is taken as the height of the plume centroid above the mixed layer and is given as
hep 0.5(hs zi ) 0.75heq
C. Concentration in the Stable Boundary Layr (SBL), Cs ( xr , yr , z )
( z h es 2mzieff ) 2
( z h es 2mzieff ) 2
Q
Cs ( xr , yr , z )
Fy exp
exp
2
2
2 zs
2 zs
2 u zs m
where zieff is the effective mechanical mixer layer height, zs is the total vertical dispersion in
SBL, and hes is the plume height (that is, stack height plume the plume rise).
Reference:
AERMOD: Description of Model Formulation, EPA-454-R-03-004 (2004)


