Differentiating Factors in Constructing Market Indexes
advertisement
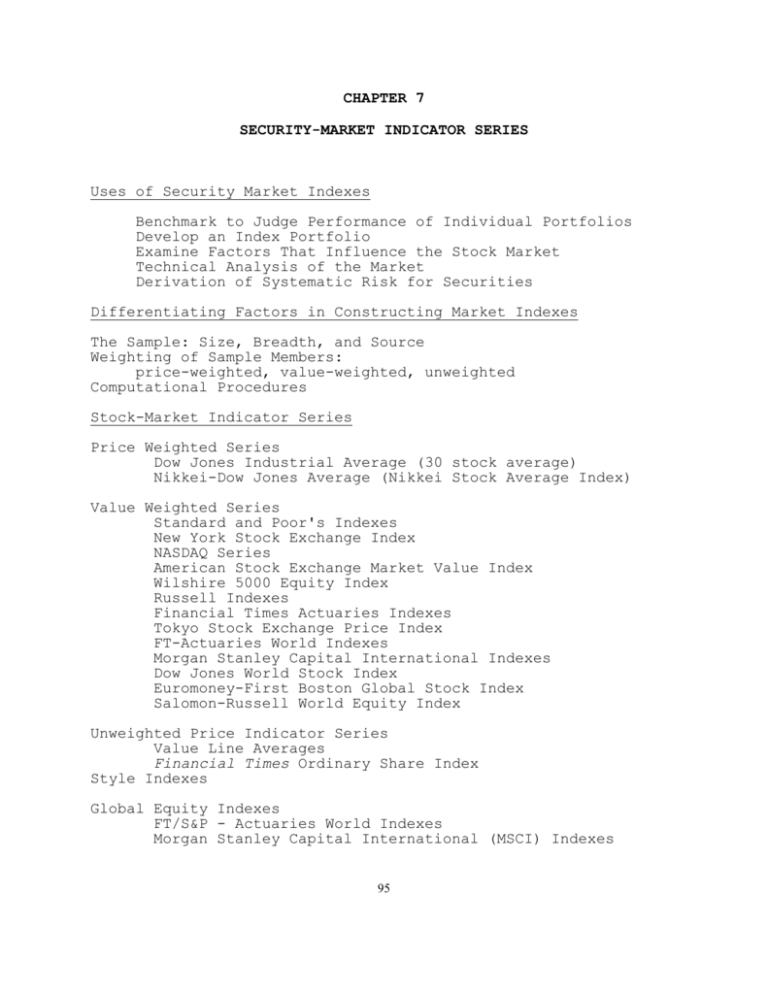
CHAPTER 7 SECURITY-MARKET INDICATOR SERIES Uses of Security Market Indexes Benchmark to Judge Performance of Individual Portfolios Develop an Index Portfolio Examine Factors That Influence the Stock Market Technical Analysis of the Market Derivation of Systematic Risk for Securities Differentiating Factors in Constructing Market Indexes The Sample: Size, Breadth, and Source Weighting of Sample Members: price-weighted, value-weighted, unweighted Computational Procedures Stock-Market Indicator Series Price Weighted Series Dow Jones Industrial Average (30 stock average) Nikkei-Dow Jones Average (Nikkei Stock Average Index) Value Weighted Series Standard and Poor's Indexes New York Stock Exchange Index NASDAQ Series American Stock Exchange Market Value Index Wilshire 5000 Equity Index Russell Indexes Financial Times Actuaries Indexes Tokyo Stock Exchange Price Index FT-Actuaries World Indexes Morgan Stanley Capital International Indexes Dow Jones World Stock Index Euromoney-First Boston Global Stock Index Salomon-Russell World Equity Index Unweighted Price Indicator Series Value Line Averages Financial Times Ordinary Share Index Style Indexes Global Equity Indexes FT/S&P - Actuaries World Indexes Morgan Stanley Capital International (MSCI) Indexes 95 Dow Jones World Stock Index Comparison of World Stock Indexes Bond-Market Indicator Series Investment-Grade Bond Indexes Lehman Brothers Merrill Lynch Ryan Treasury Salomon Brothers High-Yield Bond Indexes U.S. High-Yield Bond Indexes Merrill Lynch Convertible Securities Indexes Global Government Bond Market Indexes Composite Stock-Bond Indexes Merrill Lynch-Wilshire U.S. Capital Markets Index (ML-WCMI) Brinson Partners Global Security Market Index (GSMI) Comparison of Indexes Over Time Correlations Among Monthly Equity Price Changes Correlations Among Monthly Bond Series Mean Annual Stock Price Changes 96 CHAPTER 7 Answers to Questions 1. The purpose of market indicator series is to provide a general indication of the aggregate market changes or market movements. More specifically, the indicator series are used to derive market returns for a period of interest and then used as a benchmark for evaluating the performance of alternative portfolios. A second use is in examining the factors that influence aggregate stock price movements by forming relationships between market (series) movements and changes in the relevant variables in order to illustrate how these variables influence market movements. A further use is by technicians who use past aggregate market movements to predict future price patterns. Finally, a very important use is in portfolio theory, where the systematic risk of an individual security is determined by the relationship of the rates of return for the individual security to rates of return for a market portfolio of risky assets. Here, a representative market indicator series is used as a proxy for the market portfolio of risky assets. 2. A characteristic that differentiates alternative market indicator series is the sample--the size of the sample (how representative of the total market it is) and the source (whether securities are of a particular type or a given segment of the population (NYSE, TSE). The weight given to each member plays a discriminatory role--with diverse members in a sample, it would make a difference whether the series is price-weighted, value-weighted, or unweighted. Finally, the computational procedure used for calculating return--i.e., whether arithmetic mean, geometric mean, etc. 3. A price-weighted series is an unweighted arithmetic average of current prices of the securities included in the sample-i.e., closing prices of all securities are summed and divided by the number of securities in the sample. A $100 security will have a greater influence on the series than a $25 security because a 10 percent increase in the former increases the numerator by $10 while it takes a 40 percent increase in the price of the latter to have the same effect. 97 4. A value-weighted index begins by deriving the initial total market value of all stocks used in the series (market value equals number of shares outstanding times current market price). The initial value is typically established as the base value and assigned an index value of 100. Subsequently, a new market value is computed for all securities in the sample and this new value is compared to the initial value to derive the percent change which is then applied to the beginning index value of 100. 5. Given a four security series and a 2-for-1 split for security A and a 3-for-1 split for security B, the divisor would change from 4 to 2.8 for a price-weighted series. Stock Before Split Price After Split Prices A $20 $10 B 30 10 C 20 20 D 30 30 Total 100/4 = 25 70/x = 25 x = 2.8 The price-weighted series adjusts for a stock split by deriving a new divisor that will ensure that the new value for the series is the same as it would have been without the split. The adjustment for a value-weighted series due to a stock split is automatic. The decrease in stock price is offset by an increase in the number of shares outstanding. Before Split Stock Price/Share A $20 B 30 C 20 D 30 Total # of Shares 1,000,000 500,000 2,000,000 3,500,000 $ Market Value 20,000,000 15,000,000 40,000,000 105,000,000 $180,000,000 The $180,000,000 base value is set equal to an index value of 100. After Split Stock Price/Share A $10 B 10 C 20 D 30 Total # of Shares 2,000,000 1,500,000 2,000,000 3,500,000 98 Market Value $ 20,000,000 15,000,000 40,000,000 105,000,000 $180,000,000 Current Market Value New Index Value = -------------------- x Beginning Index Value Base Value 180,000,000 = ----------- x 100 180,000,000 = 100 which is precisely what one would expect since there has been no change in prices other than the split. 6. In an unweighted price indicator series, all stocks carry equal weight irrespective of their price and/or their value. One way to visualize an unweighted series is to assume that equal dollar amounts are invested in each stock in the portfolio, for example, an equal amount of $1,000 is assumed to be invested in each stock. Therefore, the investor would own 25 shares of GM ($40/share) and 40 shares of Coors Brewing ($25/share). a $100 stock. An unweighted price index which consists of the above three stocks would be constructed as follows: Stock GM Coors Total Price/Share $ 40 25 # of Shares 25 40 Market Value $1,000 1,000 $2,000 # of Shares 25 40 Market Value $1,200 1,000 $2,200 # of Shares 25 40 Market Value $1,000 1,200 $2,200 A 20% price increase in GM: Stock GM Coors Total Price/Share $ 48 25 A 20% price increase in Coors: Stock GM Coors Total Price/Share $ 40 30 Therefore, a 20% increase in either stocks would have the same impact on the total value of the index (i.e., in all cases the index increases by 10%. An alternative treatment is to compute percentage changes for each stock and derive the average of these percentage changes. In 99 this case, the average would be 10% (20% - 0%)). So in the case of an unweighted price-indicator series, a 20% price increase in GM would have the same impact on the index as a 20% price increase of Coors Brewing. 7. Based upon the sample from which it is derived and the fact that is a value-weighted index, the Wilshire 5000 Equity Index is a weighted composite of the NYSE composite index, the AMEX market value series, and the NASDAQ composite index. We would expect it to have the highest correlation with the NYSE Composite Index because the NYSE has the highest market value. The AMEX index would have the lowest correlation with the Wilshire Index. 8. The high correlations between returns for alternative NYSE price indicator series can be attributed to the source of the sample (i.e. stock traded on the NYSE). The four series differ in sample size, that is, the DJIA has 30 securities, the S&P 400 has 400 securities, the S&P 500 has 500 securities, and the NYSE Composite about 2330 stocks. The DJIA differs in computation from the other series, that is, the DJIA is a price-weighted series where the other three series are value-weighted. Even so, there is strong correlation between the series because of similarity of types of companies. 9. The two stock price indexes (Tokyo SE and Nikkei) for the Tokyo Stock Exchange listed in Exhibit 7.15 show a high positive correlation (.868). However, the two indexes represent substantially different sample sizes and weighting schemes. The Nikkei-Dow Jones Average consists of 225 companies and is a price weighted series. Alternatively, the Tokyo SE encompasses a much large set of 1800 companies and is a value-weighted series. 100 Although the NYSE is the only index listed in Exhibit 7.15 that includes just NYSE stocks, the S&P 500 has a high concentration of NYSE stocks. Both indexes are valueweighted but are different in sample size. However, the two indexes are highly correlated (.993). The correlation between the TSE indexes (Tokyo SE and Nikkei) and NYSE series (S&P 500 and NYSE) are substantially lower (between .306 and .391). These results support the argument for diversification among countries. 10. Since the equal weighted series implies that all stocks carry the same weight, irrespective of price or value, the results indicate that on average all stocks in the index increased by 23 percent. On the other hand, the percentage change in the value of a large company has a greater impact than the same percentage change for a small company in the value weighted index. Therefore, the difference in results indicate that for this given period, the smaller companies in the index outperformed the larger companies. 11. The bond-market series are more difficult to construct due to the wide diversity of bonds available. Also bonds are hard to standardize because their maturities and market yields are constantly changing. In order to better segment the market, you could construct five possible subindexes based on coupon, quality, industry, maturity, and special features (such as call features, warrants, convertibility, etc.). 12. Since the Merrill Lynch-Wilshire Capital Markets index is composed of a distribution of bonds as well as stocks, the fact that this index increased by 15 percent, compared to a 5 percent gain in the Wilshire 5000 Index indicates that bonds outperformed stocks over this period of time. 13. The Russell 1000, and Russell 2000 represent two different population sample of stocks, segmented by size. The fact that the Russell 2000 (which is composed of the smallest 2,000 stocks in the Russell 3000) increased more than the Russell 1000 (composed of the 1000 largest capitalization U.S. stocks) indicates that small stocks performed better during this time period. 14. One would expect that the level of correlation between the various world indexes should be relatively high. These indexes tend to include the same countries and the largest capitalization stocks within each country. 15. High yield bonds (ML High Yield Bond Index) have definite equity characteristics. Consequently, they are more highly 101 correlated with the NYSE composite stock index rather than the ML Aggregate Bond Index. 16. Based on Exhibit 7.16, MLJA – Japan Government bonds would be the best choice for diversification with U.S Government bonds (LBGC), because the correlation between LBGC and MLJA is 0.113, suggesting that this investment affords the best opportunity to diversify risk. 102 CHAPTER 7 Answers to Problems 1(a). Given a three security series and a price change from period T to T+1, the percentage change in the series would be 42.85 percent. A B C Sum Divisor Average Period T $ 60 20 18 $ 98 3 32.67 Period T+1 $ 80 35 25 $140 3 46.67 46.67 - 32.67 14.00 Percentage change = ------------- = ----- = 42.85% 32.67 32.67 1(b). Stock A B C Total Stock A B C Total Period Price/Share $60 20 18 T # of Shares 1,000,000 10,000,000 30,000,000 Period Price/Share $ 80 35 25 T+1 # of Shares 1,000,000 10,000,000 30,000,000 Market Value $ 60,000,000 200,000,000 540,000,000 $800,000,000 1,180 - 800 380 Percentage change = ----------- = --- = 800 800 Market Value $ 80,000,000 350,000,000 750,000,000 $1,180,000,000 1(c). 47.50% The percentage change for the price-weighted series is a simple average of the differences in price from one period to the next. Equal weights are applied to each price change. 103 The percentage change for the value-weighted series is a weighted average of the differences in price from one period T to T+1. These weights are the relative market values for each stock. Thus, Stock C carries the greatest weight followed by B and then A. Because Stock C had the greatest percentage increase and the largest weight, it is easy to see that the percentage change would be larger for this series than the price-weighted series. 2(a). Stock A B C Total Stock A B C Total Period T Price/Share # of Shares $ 60 16.67 20 50.00 18 55.56 Period T+1 Price/Share # of Shares $ 80 16.67 35 50.00 25 55.56 Market Value $1,000.00 1,000.00 1,000.00 $3,000.00 Market Value $1,333.60 1,750.00 1,389.00 $4,472.60 4,472.60 - 3,000 1,472.60 Percentage change = ---------------- = -------- = 49.09% 3,000 3,000 2(b). 80 - 60 20 Stock A = ------- = --- = 33.33% 60 60 35 - 20 15 Stock B = ------- = --- = 75.00% 20 20 25 - 18 7 Stock C = ------- = --- = 38.89% 18 18 104 33.33% + 75.00% + 38.89% Arithmetic average = -----------------------3 147.22% = ------- = 49.07% 3 The answers are the same (slight difference due to rounding). This is what you would expect since Part A represents the percentage change of an equal-weighted series and Part B applies an equal weight to the separate stocks in calculating the arithmetic average. 2(c). Geometric average is the nth root of the product of n items. Geometric average = [(1.3333)(1.75)(1.3889)]1/3 - 1 = [3.2407]1/3 - 1 = 1.4798 - 1 = .4798 or 47.98% The geometric average is less than the arithmetic average. This is because variability of return has a greater affect on the arithmetic average than the geometric average. 3. Student Exercise 4(a). 30 DJIA = ð Pit/Dadj i=1 Company A B C Price/Share Day 1 12 23 52 12 + 23 + 52 87 DJIA = ------------ = --- = 29 3 3 105 Company A B C (Before Split) Price/Share 10 22 55 Day 2 10 + 22 + 55 DJIA = -----------3 (After Split) Price/Share 10 44 55 10 + 44 + 55 DJIA = -----------X 87 = --- = 29 3 109 29 = --X X = 3.7586 (new divisor) Company A B C (Before Split) Price/Share 14 46 52 14 + 46 + 52 DJIA = -----------3.7586 Day 3 (After Split) Price/Share 14 46 26 14 + 46 + 26 DJIA = -----------Y = 29.798 112 = -----3.7586 86 29.798 = --Y Y = 2.8861 (new divisor) Company A B C Price/Share 13 47 25 Day 4 13 + 47 + 25 DJIA = -----------2.8861 85 = ------ = 29.452 2.8861 106 Company A B C Price/Share 12 45 26 Day 5 12 + 45 + 26 DJIA = -----------2.8861 83 = ------ = 28.759 2.8861 4(b). Since the index is a price-weighted average, the higher priced stocks carry more weight. But when a split occurs, the new divisor ensures that the new value for the series is the same as it would have been without the split. Hence, the main effect of a split is just a repositioning of the relative weight that a particular stock carries in determining the index. For example, a 10% price change for company B would carry more weight in determining the percent change in the index in Day 3 after the reverse split that increased its price, than its weight on Day 2. 4(c). Student Exercise 5(a). Base = ($12 x 500) + ($23 x 350) + ($52 x 250) = $6,000 + $8,050 + $13,000 = $27,050 Day 1 = ($12 x 500) + ($23 x 350) + ($52 x 250) = $6,000 + $8,050 + $13,000 = $27,050 Index1 = ($27,050/$27,050) x 10 = 10 Day 2 = ($10 x 500) + ($22 x 350) + ($55 x 250) = $5,000 + $7,700 + $13,750 = $26,450 Index2 = ($26,450/$27,050) x 10 = 9.778 Day 3 = ($14 x 500) + ($46 x 175) + ($52 x 250) = $7,000 + $8,050 + $13,000 = $28,050 Index3 = ($28,050/$27,050) x 10 = 10.370 107 Day 4 = ($13 x 500) + ($47 x 175) + ($25 x 500) = $6,500 + $8,225 + $12,500 = $27,225 Index4 = ($27,225/$27,050) x 10 = 10.065 Day 5 = ($12 x 500) + ($45 x 175) + ($26 x 500) = $6,000 + $7,875 + $13,000 = $26,875 Index5 = ($26,875/$27,050) x 10 = 9.935 5(b). The market values are unchanged due to splits and thus stock splits have no effect. The index, however, is weighted by the relative market values. 6. Price-weighted index(PWI)2002 = (20 + 80+ 40)/3 = 46.67 To accounted for stock split, a new divisor must be calculated: (20 + 40 + 40)/X = 46.67 X = 2.143 (new divisor after stock split) Price-weighted index2003 = (32 + 45 + 42)/2.143 = 55.53 VWI2002 = 20(100,000,000) + 80(2,000,000) + 40(25,000,000) = 2,000,000,000 + 160,000,000 + 1,000,000,000 = 3,160,000,000 assuming a base value of 100 and 2002 as base period, then 3,160,000,000/3,160,000,000 x 100 = 100 VWI2003 = 32(100,000,000) + 45(4,000,000) + 42(25,000,000) = 3,200,000,000 + 180,000,000 + 1,050,000,000 = 4,430,000,000 assuming a base value of 100 and 2002 as period, then 4,430,000,000/3,160,000,000 x 100= 1.4019 x 100 = 140.19 6(a). Percentage change in PWI = (55.53 - 46.67)/46.67 = 18.99% Percentage change in VWI = (140.19 - 100)/100 = 40.19% 6(b). The percentage change in VWI was much greater than the change in the PWI because the stock with the largest market value (K) had the grater percentage gain in price (60% increase). 108 6(c). Stock K M R Total Stock A B C Total December 31, 2002 Price/Share # of Shares $ 20 50.0 80 12.5 40 25.0 December 31, 2003 Price/Share # of Shares $ 32 50.0 45 25.0* 42 25.0 Market Value $1,000.00 1,000.00 1,000.00 $3,000.00 Market Value $1,600.00 1,125.00 1,050.00 $3,775.00 (*Stock-split two-for-one during the year) 3,775.00 - 3,000 775.00 Percentage change = ---------------- = -------- = 25.83% 3,000 3,000 (As a geometric average = [(1.60)(1.125)(1.05)]1/3 - 1 = [1.89]1/3 - 1 = 1.2364 - 1 = .2364 or 23.64% Unweighted averages are not impacted by large changes in stocks prices (i.e. price-weighted series) or in market values (i.e. value-weighted series). CHAPTER 7 Answers to Combined Web and Spreadsheet Exercises Student Exercise. 109


