Chapter One: Molecular Structure
advertisement
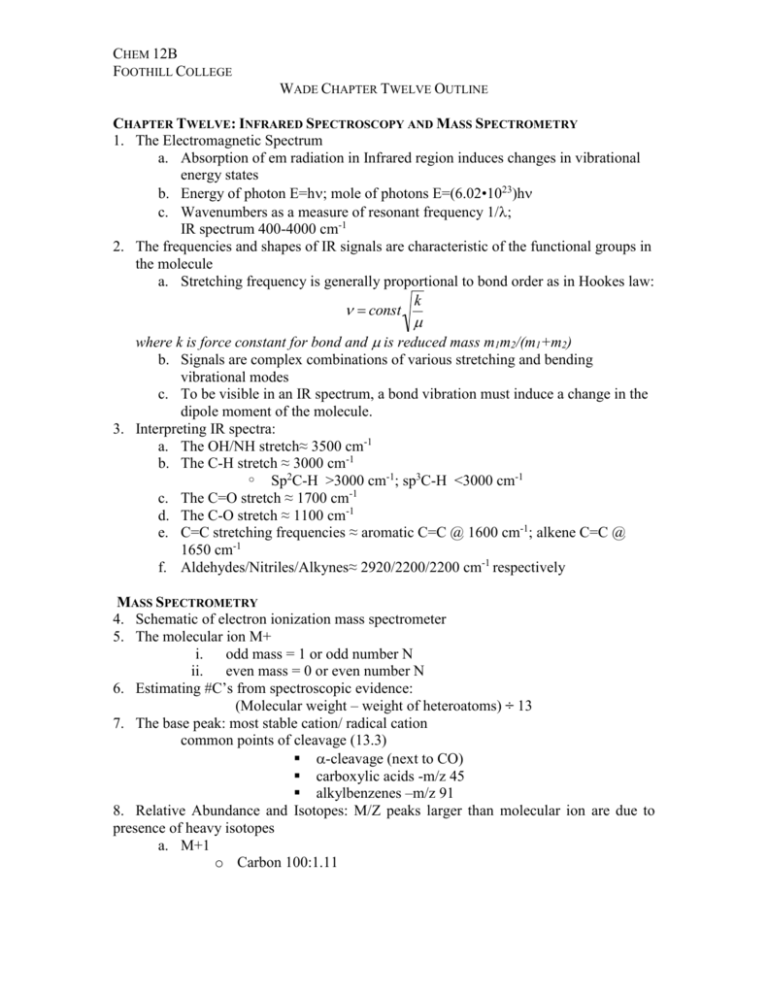
CHEM 12B FOOTHILL COLLEGE WADE CHAPTER TWELVE OUTLINE CHAPTER TWELVE: INFRARED SPECTROSCOPY AND MASS SPECTROMETRY 1. The Electromagnetic Spectrum a. Absorption of em radiation in Infrared region induces changes in vibrational energy states b. Energy of photon E=h; mole of photons E=(6.02•1023)h c. Wavenumbers as a measure of resonant frequency 1/; IR spectrum 400-4000 cm-1 2. The frequencies and shapes of IR signals are characteristic of the functional groups in the molecule a. Stretching frequency is generally proportional to bond order as in Hookes law: k n = const m where k is force constant for bond and is reduced mass m1m2/(m1+m2) b. Signals are complex combinations of various stretching and bending vibrational modes c. To be visible in an IR spectrum, a bond vibration must induce a change in the dipole moment of the molecule. 3. Interpreting IR spectra: a. The OH/NH stretch≈ 3500 cm-1 b. The C-H stretch ≈ 3000 cm-1 o Sp2C-H >3000 cm-1; sp3C-H <3000 cm-1 c. The C=O stretch ≈ 1700 cm-1 d. The C-O stretch ≈ 1100 cm-1 e. C=C stretching frequencies ≈ aromatic C=C @ 1600 cm-1; alkene C=C @ 1650 cm-1 f. Aldehydes/Nitriles/Alkynes≈ 2920/2200/2200 cm-1 respectively MASS SPECTROMETRY 4. Schematic of electron ionization mass spectrometer 5. The molecular ion M+ i. odd mass = 1 or odd number N ii. even mass = 0 or even number N 6. Estimating #C’s from spectroscopic evidence: (Molecular weight – weight of heteroatoms) ÷ 13 7. The base peak: most stable cation/ radical cation common points of cleavage (13.3) -cleavage (next to CO) carboxylic acids -m/z 45 alkylbenzenes –m/z 91 8. Relative Abundance and Isotopes: M/Z peaks larger than molecular ion are due to presence of heavy isotopes a. M+1 o Carbon 100:1.11 CHEM 12B FOOTHILL COLLEGE WADE CHAPTER TWELVE OUTLINE o Calculating #C’s from ratio M: M+1: %(M+1)/%(M) ≈ .011 • #C’s b. M+2 o Chlorine 3:1 o Bromine 1:1 o Oxygen 99.8:0.2 o High Resolution MS 9. Proposing a Molecular Formula using Combination Spectroscopy LEARNING OUTCOMES: Identify functional groups present in an organic molecule from its Infrared Spectrum. Assign characteristic signals in an Infrared Spectrum to specific functional groups. Calculate the energy of Infrared radiation from its frequency or wavelength and viceversa. Use Hooke’s law to predict the stretching frequency of a given bond. Find molecular ion and base peak in mass spectrum. Interpret relative abundance of M and M+1 or M+2 signals in order to determine presence of halogen or number of carbon or oxygen atoms, when appropriate. Predict stable points of cleavage for a given molecule. Use Mass Spectrometry in conjunction with other spectra to elucidate the structure of an organic molecule whose molecular formula is unknown. SAMPLE EXAM PROBLEMS: 1) Which of the following is true about the compound whose Mass Spectrum is shown below: A) The compound contains bromine. B) The compound contains chlorine. C) The compound contains nitrogen. D) The compound has a molecular weight of 86. E) None of these can be ascertained from the Mass Spectrum alone. CHEM 12B FOOTHILL COLLEGE WADE CHAPTER TWELVE OUTLINE 2) Propose a stucture for the base peak in the following mass spectrum of 2-heptanone: 3) Consider the spectrum below and tell whether it is consistent with any or all of the following : a. Benzoic acid (PhCOOH) e. Cyclohexylamine (C6H13NH2) b. Toluene (PhCH3) f. Aniline (PhNH2) c. Styrene (PhCH=CH2) g. Methylaniline (CH3PhNH2) d. Cyclohexanol (C6H13OH) h. Cyclohexene 4) Consider the spectrum below and tell whether it is consistent with any or all of the following : A) Pentanoic acid (C4H9COOH) E) N-methylcyclopentane B) 3-hydroxycyclohexene F) Methylaniline (CH3PhNH2) C) Styrene (PhCH=CH2) G) 3-hexyne D) Cyclohexanol (C6H13OH) H) Phenol (PhOH) CHEM 12B FOOTHILL COLLEGE WADE CHAPTER TWELVE OUTLINE 5) Tell which of the following would be expected to show a lower frequency carbonyl stretching band in its IR spectrum? Explain.

