Lec 25 - An
advertisement
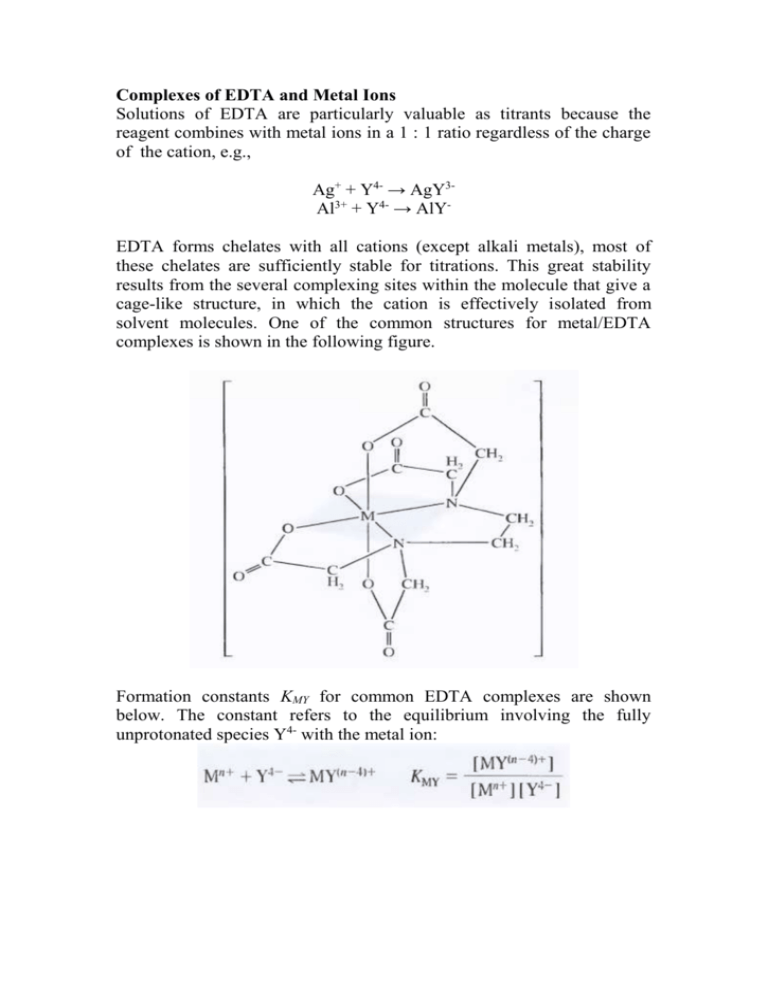
Complexes of EDTA and Metal Ions Solutions of EDTA are particularly valuable as titrants because the reagent combines with metal ions in a 1 : 1 ratio regardless of the charge of the cation, e.g., Ag+ + Y4- → AgY3Al3+ + Y4- → AlYEDTA forms chelates with all cations (except alkali metals), most of these chelates are sufficiently stable for titrations. This great stability results from the several complexing sites within the molecule that give a cage-like structure, in which the cation is effectively isolated from solvent molecules. One of the common structures for metal/EDTA complexes is shown in the following figure. Formation constants KMY for common EDTA complexes are shown below. The constant refers to the equilibrium involving the fully unprotonated species Y4- with the metal ion: Equilibrium Calculations Involving EDTA A titration curve for the reaction of a cation M n+ with EDTA consists of a plot of pM versus reagent volume. Values for pM are readily computed in the early stage of a titration by assuming that the equilibrium concentration of Mn+ is equal to its analytical concentration, which in turn is readily derived from stoichiometric data. Calculation of Mn+ at and beyond the equivalence point is troublesome if the pH is unknown and variable because both [MY(n-4)+] and [Mn+] are pH dependent. EDTA titrations are always performed in buffered solutions to avoid interference by other cations or to ensure satisfactory indicator behavior. Calculating [Mn+] in a buffered solution containing EDTA is a relatively straightforward procedure provided that the pH is known. In this computation, use is made of the alpha value for H 4Y which can be defined as: α4 = [Y4-]/CT where CT is the total molar concentration of uncomplexed EDTA CT = [Y4-] + [HY3-] + [H2Y2-] + [H3Y-] + [H4Y] Conditional Formation Constants By substituting [Y4-] in the formation constant expression by α 4CT we obtain the conditional formation constant: K'MY is a constant only at the pH for which α4 is applicable. Replacement of [Y4-] with CT simplifies calculations because CT is easily determined from the reaction stoichiometry, whereas [Y4-] is not. Example 1 Calculate the molar Y4- concentration in a 0.0200 M EDTA solution buffered to a pH of 10.00. At pH 10.00, α4 is 0.35. [Y4-] = α4CT = 0.35 X 0.0200 = 7.00 X 10⁻³M Example 2 Calculate the equilibrium concentration of Ni 2+ in a solution with an analytical NiY2- concentration of 0.0150 M at pH (a) 3.0 and (b) 8.0. Ni2+ + Y4- ↔ NiY2-, KNiY = [NiY2-]/[Ni2+][Y4-] = 4.2 X 10¹⁸ [NiY2-] = 0.0150 - [Ni2+] ≈ 0.0150 M (KMY is large) [Ni2+] = [Y4-] + [HY3-] + [H2Y2-] + [H3Y-] + [H4Y] = CT K'MY = [NiY2-]/[Ni2+]CT = α4 KMY a) At pH 3, α4 is 2.5 X 10⁻¹¹, so 2.5 X 10-11 X 4.2 X 1018 = 0.0150/[Ni2+]2 [Ni2+] = 1.2 X 10⁻⁵ M b) At pH 8, α4 is 5.4 X 10⁻³, so 5.4 X 10-3 X 4.2 X 1018 = 0.0150/[Ni2+]2 [Ni2+] = 8.1 X 10⁻¹⁰ M Example 3 Calculate the concentration of Ni2+ in a solution that was prepared by mixing 50.0 mL of 0.0300 M Ni2+ with 50.00 mL of 0.0500 M EDTA. The mixture was buffered to a pH of 3.0. [Ni2+] = 50.00 X 0.0300/100 mL = 0.0150 M [EDTA] = (50.00 X 0.0500 – 50.0 X 0.0300)/100 = 0.0100 M [NiY2-] = 0.0150 – [Ni2+] ≈ 0.0150 The total concentration of uncomplexed EDTA, CT = 0.0100 M K'MY = α4 KMY = [NiY2-]/[Ni2+]CT 1.05 X 108 = 0.0150/[Ni2+] 0.0100 [Ni2+] = 1.4 X 10⁻⁸ M EDTA Titration Curves Similar calculations are made for derivation of EDTA titration curves as shown in the following example Example 4 Construct a titration curve for the titration of 50.0 mL of 0.00500 M Ca + with 0.0100 M EDTA in a solution buffered to a constant pH of 10.0. Initial pCa pCa = - Log [Ca2+] = - Log (0.00500) = 2.30 Preequivalence-Point Values for pCa (5.00 mL EDTA) [Ca2+] = excess [Ca2+] + CT ≈ excess [Ca2+] [Ca2+] = (50.0 mL X 0.00500 M - 5.00 mL X 0.0100 M)/(50.00 + 5.00) mL = 3.64 X 10⁻³ M pCa = 2.44 Equivalence-Point pCa (25.0 mL EDTA) At the equivalence point, we first compute the analytical concentration of CaY2-: [CaY2-] = (50.0 X 0.00500) mmol/(50.0 + 25.0) mL = 3.33 X 10⁻³ Ca2+ = CT K'MY = α4 KMY = [CaY2-]/[Ca2+]CT 0.35 X 5.0 X l010 = 3.33 X 10⁻³/[Ca2+]2 [Ca2+] = 4.36 X 10⁻⁷ M pCa = 6.36 Postequivalence-Point pCa (26.0 mL EDTA) Analytical concentrations of CaY2- and EDTA are obtained directly from the stoichiometric data. EDTA is now in excess: [CaY2-] = (50.0 X 0.00500) mmol/(50.0 + 26.0) mL = 3.29 X 10⁻³ M [EDTA] = CT = (26.0 X 0.0100 - 50.0 X 0.00500)/76.0 mL = 1.31 X 10⁻⁴ M K'MY = α4 KMY = [CaY2-]/[Ca2+]CT 0.35 X 5.0 X l010 = 3.29 X 10⁻³/[Ca2+]1.31 X 10-4 [Ca2+] = 1.41 X 10⁻⁹ M pCa = 8.84 The titration Curve for this system is shown below (curve A). Curve B is the titration curve for a solution of magnesium ion under identical conditions. The change in the p-function in the equivalence-point region of magnesium is smaller than that of calcium. CaY2- complex has greater formation constant than MgY2- complex. The next figure shows titration curves for calcium ion in solutions buffered to various pH levels. α4, and hence K'CaY, becomes smaller as pH decreases. The smaller equilibrium constant leads to a smaller change in pCa in the equivalencepoint region. It can be seen that an adequate end point in the titration of calcium requires a pH of about 8 or greater. As shown in the figure below, cations with larger formation constants provide good end points even in acidic media. The next figure shows the minimum permissible pH for a satisfactory end point in the titration of various metal ions. A moderately acidic environment is satisfactory for many divalent heavy-metal cations and a strongly acidic medium can be tolerated in the titration of such ions as iron(III) and indium(III).
