Community profile - City of Port Phillip Have Your Say
advertisement
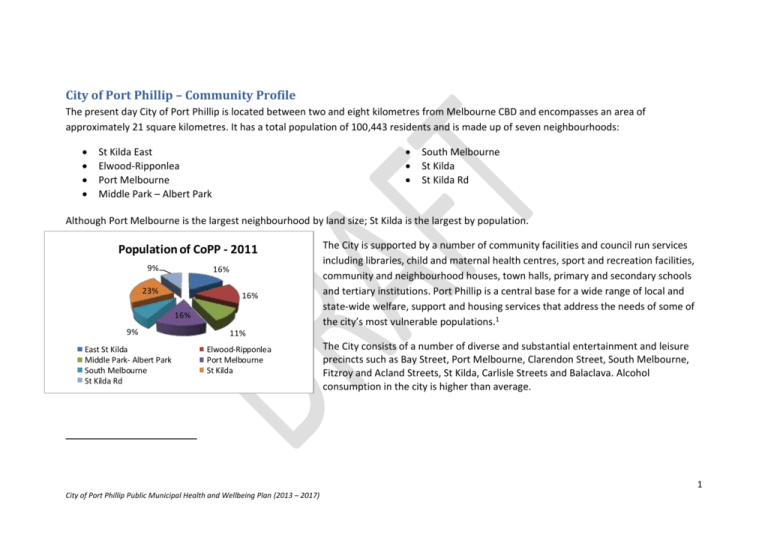
City of Port Phillip – Community Profile The present day City of Port Phillip is located between two and eight kilometres from Melbourne CBD and encompasses an area of approximately 21 square kilometres. It has a total population of 100,443 residents and is made up of seven neighbourhoods: St Kilda East Elwood-Ripponlea Port Melbourne Middle Park – Albert Park South Melbourne St Kilda St Kilda Rd Although Port Melbourne is the largest neighbourhood by land size; St Kilda is the largest by population. Population of CoPP - 2011 9% 16% 23% 16% 16% 9% East St Kilda Middle Park- Albert Park South Melbourne St Kilda Rd The City is supported by a number of community facilities and council run services including libraries, child and maternal health centres, sport and recreation facilities, community and neighbourhood houses, town halls, primary and secondary schools and tertiary institutions. Port Phillip is a central base for a wide range of local and state-wide welfare, support and housing services that address the needs of some of the city’s most vulnerable populations.1 11% Elwood-Ripponlea Port Melbourne St Kilda The City consists of a number of diverse and substantial entertainment and leisure precincts such as Bay Street, Port Melbourne, Clarendon Street, South Melbourne, Fitzroy and Acland Streets, St Kilda, Carlisle Streets and Balaclava. Alcohol consumption in the city is higher than average. 1 City of Port Phillip Public Municipal Health and Wellbeing Plan (2013 – 2017) Nearly half (47.2%) of Port Phillip’s population is aged between 25 and 44 years. Over the last decade, the majority of people moving into Port Philip were in the 35-49 year age cohort. 284 people identify as Aboriginal or Torres Strait Islander in addition, the majority of whom are aged between 25 and 44 years. Nine people (including three non-indigenous persons) speak an Australian Indigenous language at home. 89% of people who identify as Aboriginal or Torres Strait Islander in Port Phillip are employed in a full or part time capacity; and nearly 30% are engaged in full or part time study. The city of Port Phillip also has a strong gay, lesbian, bisexual, transgender, and intersex community, including 698 same sex couples who constitute 1.5% of the Port Phillip community.2 Residents from non-English speaking countries make up 18% of the City’s population and account for 27% of those who have moved into Port Phillip since 2006. Although the majority of people born overseas come from the UK, New Zealand and Greece, there are significant populations from Russia in South Melbourne, the Ukraine in St Kilda, India in St Kilda East and China in St Kilda Rd. More than 21.4% of people speak a language other than English at home. The traditionally dominant non-English languages (Greek, Russian, Italian) are still spoken in Port Phillip; however, Mandarin, Hindi and Spanish are becoming more widely spoken across the municipality. 2 By contrast, same sex couples constitutes only 0.4% of the population of Greater Melbourne 2 City of Port Phillip Public Municipal Health and Wellbeing Plan (2013 – 2017) Christianity remains the dominant religion in Port Phillip (43.5% of people are Christian); however, compared to greater Melbourne a relatively high number of people follow no religion. Port Phillip also has a significant Jewish population who constitute 4.3% of the population as compared to just 1.1% of the population of greater Melbourne. Port Phillip has the highest density of dwellings in Victoria, with approximately 85% of homes categorised as medium or high density. There is a predominance of lone person households and couples without children. Nearly 46% of those aged 75 and over live alone, the second highest of all local governments across Victoria. Despite this, the rate of age pension recipients is well below average.3 Port Phillip is considered a relatively affluent city. Employed residents of Port Phillip were most likely to earn over $2000 per week,4 and 62.8% of households in Port Phillip fall within the top two household income quartiles.5 However, these statistics often masks the pockets of disadvantage which exist in the City. Port Phillip has the second highest concentration of community housing in Victoria – 7.5% of all housing in Port Phillip is community housing - and almost 8% of residents currently live in community housing. Women are more likely to complete a higher education qualification than men (54% of those with qualifications were women). This is particularly the case at the graduate degree level where 64% of people with this qualification are women. Despite this, men are more likely to earn a higher wage than women – the gender gap is widest for those who earned $2000 and over per week. There is a relatively low rate of private car ownership across the City (18.5% of the population do not own a car) and a large proportion of residents (27%) rely on public transport, or walk or cycle (9.3%) to get to and from work. 3 Department of Health, Local Government Area Profile 2012 14% of employed persons earned over $2000 per week. 5 ABS Census of Population Housing 2011 4 3 City of Port Phillip Public Municipal Health and Wellbeing Plan (2013 – 2017) There are over 50 public parks, reserves, and foreshore areas in the municipality which residents and visitors regularly utilise for recreation and other activities. While the percentage of residents who do not meet daily physical activity guidelines is low, nearly 45% sit for an average of seven hours per day.6 Walking St Kilda Rd and cycling are a primary form of recreation and exercise for many residents including 34.6% of children aged 2-9 years and 46% of children aged 10-17 who ride their bike at St Kilda Rd is a long, narrow neighbourhood quite demographically and geographically different from least once in a typical week.7 the other Port Phillip Neighbourhoods. It is Social connectedness is relatively strong in the area, with higher proportions of people predominantly populated by those aged 25-34 years embracing multiculturalism and undertaking voluntary work through an organisation and has a high percentage of university students, lone or group than Victoria, but a lower percentage of people providing unpaid assistance person households and young couples without children. It has a substantially higher number of to a person with a disability. residents who were born overseas and speak a language other than English at home – primarily Forecasts Mandarin and Hindi, as opposed to languages such as The population of Port Phillip is expected to increase by 26.14% by 2031. While it is Greek, Italian and Russian which are more widely predicted that the majority of the population will be aged between 25 and 34 years; spoken in other Port Phillip neighbourhoods. there will likely be a significant increase in people aged 0 to 4 and those over 65. Of all neighbourhoods, St Kilda Rd has the Anecdotal evidence also suggests young families are remaining in the municipality highest percentage of people with a post more so graduate degree. than they The neighbourhood is characterised by its high did in the density housing and its close proximity and connections with the neighbouring municipalities past.8 As of Stonnington and Melbourne. such, associated services will need 6 Department of Health, Local Government Area Profile 2012 Australian Bicycle Council City of Port Phillip/Cycling Participation Survey, 2012 8 CoPP early years plan 2012-2015, p5 7 4 City of Port Phillip Public Municipal Health and Wellbeing Plan (2013 – 2017) to be robust enough to cope with the increased demands. Some densification is expected to occur, and lone person and couple families without children will endure as the most prevalent household types. Port Phillip will continue to be a more affluent City and will need to implement strategies to deal with increases in population, road congestion, environmental pressures and competing demands for space. 5 City of Port Phillip Public Municipal Health and Wellbeing Plan (2013 – 2017) Positive and Negative Indicators of Health – Port Phillip Positive Indicators Cancer incidence per 100,000 people Residents who commute over 2hrs per day (2011) Residents who have less than 7 hours sleep per weekday (2011) Residents who lack time for family/friends (2011) General Practitioners per 1000 population (2010) Dental Services per 1000 population (2010) Pharmacies per 1000 population (2010) Private health insurance cover Persons who delayed medical consultation because they could not afford it per 1000 population (2011) Persons who delayed purchasing prescribed medication because they could not afford it per 1000 population (2011) An active community, people do things & get involved in local issues/activities (2008) Parental participation in schools (2008) Multiculturalism makes life in the area better (2008) Safe on street after dark (2008) Completed year 12 or equivalents (2011): Male Female Individual weekly gross income $1500 plus (2011) Port Phillip 470.1 5% 18.80% 21.30% 1.64 0.26 0.26 63.0% SMR Av Melb Av Vic Av 1.12 0.19 0.19 51.7% 511.4 11.60% 31.50% 27.40% 1.11 0.17 0.19 47.9% 11.4 13.8 14.4 8.2 10.5 11.1 68.70% 66.00% 87.50% 65.50% 30.50% 32.80% 23.40% 58.30% 55% 50% 80% 57% 59% 49% 76% 58.90% 21.30% 23.20% 10.50% 19.20% 21.40% 9.40% 6 City of Port Phillip Public Municipal Health and Wellbeing Plan (2013 – 2017) Negative Indicators Children fully immunised at 24-27 months (2011) 15-17 year olds who drank alcohol in the last 30 days (2009) 15-17 year olds who smoked cigarettes (2009) People over 65 years living alone HACC Indigenous clients, per Indigenous population, 2010-11 (St Kilda SLA) HACC Non-English speaking clients, 2010 - 11 (St Kilda West SLA) Affordable rental (2012) Social housing (2011) Total estimated homeless people (2008)- 12% of Melbourne Crimes against the person rates per 100,000 (2011-12) Crimes against property rates per 100,000 (2011-12) Drug offences rates per 100,000 (2011-12) Alcohol-related ambulance attendances Alcohol-related assaults 10,000 resident population Alcohol-related serious road injuries Registered mental health clients Premature mortality from suicide and self-harm injuries (St Kilda) Avoidable mortality - all causes* (ST Kilda SLA) Port Phillip 88.10% 50.10% 18.80% 29.90% 16.10% 22.20% 0.40% 7.50% 1658 1319.3 7518.3 503.8 107.95 22.37 4.89 12.3 13.3 208.1 SMR Av Melb Av 92.60% 45.90% 15.60% Vic Av 93.10% 22.40% 5.70% 17.7% 3.40% 13770 976.5 4481.5 336.9 50.1 12.05 3.82 8.8 10.2 148.2 23.20% 6.70% 11.9% 20.70% 3.90% 17511 976.8 4762.3 336 34.09 12.7 4.09 10.9 11 158.2 7 City of Port Phillip Public Municipal Health and Wellbeing Plan (2013 – 2017)
