La Niña & ENSO: Predicting Climate Patterns
advertisement
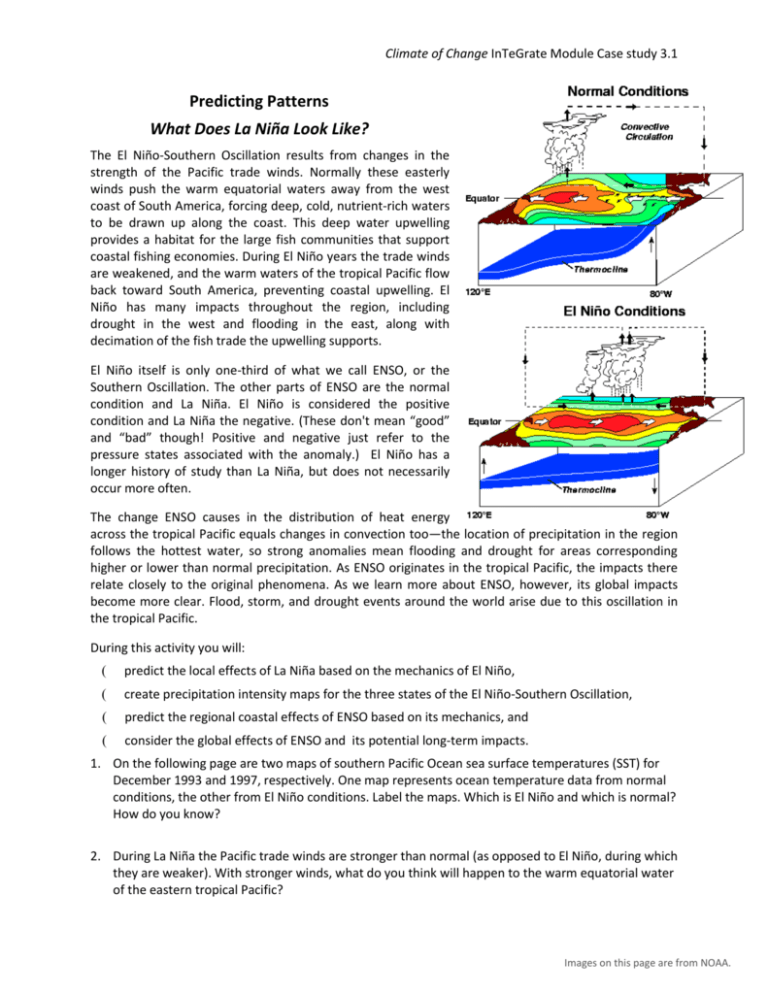
Climate of Change InTeGrate Module Case study 3.1 Predicting Patterns What Does La Niña Look Like? The El Niño-Southern Oscillation results from changes in the strength of the Pacific trade winds. Normally these easterly winds push the warm equatorial waters away from the west coast of South America, forcing deep, cold, nutrient-rich waters to be drawn up along the coast. This deep water upwelling provides a habitat for the large fish communities that support coastal fishing economies. During El Niño years the trade winds are weakened, and the warm waters of the tropical Pacific flow back toward South America, preventing coastal upwelling. El Niño has many impacts throughout the region, including drought in the west and flooding in the east, along with decimation of the fish trade the upwelling supports. El Niño itself is only one-third of what we call ENSO, or the Southern Oscillation. The other parts of ENSO are the normal condition and La Niña. El Niño is considered the positive condition and La Niña the negative. (These don't mean “good” and “bad” though! Positive and negative just refer to the pressure states associated with the anomaly.) El Niño has a longer history of study than La Niña, but does not necessarily occur more often. The change ENSO causes in the distribution of heat energy across the tropical Pacific equals changes in convection too—the location of precipitation in the region follows the hottest water, so strong anomalies mean flooding and drought for areas corresponding higher or lower than normal precipitation. As ENSO originates in the tropical Pacific, the impacts there relate closely to the original phenomena. As we learn more about ENSO, however, its global impacts become more clear. Flood, storm, and drought events around the world arise due to this oscillation in the tropical Pacific. During this activity you will: ( predict the local effects of La Niña based on the mechanics of El Niño, ( create precipitation intensity maps for the three states of the El Niño-Southern Oscillation, ( predict the regional coastal effects of ENSO based on its mechanics, and ( consider the global effects of ENSO and its potential long-term impacts. 1. On the following page are two maps of southern Pacific Ocean sea surface temperatures (SST) for December 1993 and 1997, respectively. One map represents ocean temperature data from normal conditions, the other from El Niño conditions. Label the maps. Which is El Niño and which is normal? How do you know? 2. During La Niña the Pacific trade winds are stronger than normal (as opposed to El Niño, during which they are weaker). With stronger winds, what do you think will happen to the warm equatorial water of the eastern tropical Pacific? Images on this page are from NOAA. Maps of the Reynolds Sea Surface Temperature (SST) analysis for 1993 and 1997 from the National Center for Environmental Change Case study 3.1 Prediction (NCEP) for the Pacific Ocean (70°NClimate to 70°S),of created by InTeGrate Dai McClurgModule of the TAO Project. _________________ Conditions _________________ Conditions °C La Niña Conditions warm cool 3. Fill in the blank map of La Niña SST conditions above based on your predictions. Use colors or symbols to represent contrasting warm and cool SST. Make sure to amend your map temperature legend. 4. Fish can't live in the waters off the northwestern coast of South America during El Niño years, causing the fish trade and fisher livelihoods to suffer in these areas. Does the same phenomenon occur during La Niña years? Why or why not? 5. One of the immediate effects of changing SST is changing precipitation patterns. As warm equatorial water moves through the tropical Pacific with changes in trade wind strength, so do locations of high precipitation. Why does this correlation exist? How (specifically) does SST relate to the likelihood of precipitation? 6. Based on your SST maps and the relationship you just described, create maps of precipitation intensity for El Niño, ENSO normal, and La Niña conditions on the three blank maps on the following page, using colors or symbols to show contrasting high and low precipitation. Create a legend for your maps. Precipitation Pattern — _________________ Conditions Climate of Change InTeGrate Module Case study 3.1 Precipitation Pattern — _________________ Conditions Precipitation Pattern — _________________ Conditions 7. Given that coastal ecosystems are relatively equilibrated to normal conditions, ENSO causes instabilities during both El Niño and La Niña years. In locations where it is wetter than normal, floods occur, while in those where it is drier than normal, drought ensues. Based on these general relationships and your precipitation maps above, identify the coastal impacts of El Niño and La Niña in the tropical Pacific. (Circle the appropriate options.) (HINT: Consider the definition of anomaly.) Region Anomaly Effect Impact western Pacific (Oceana & northern Australia) El Niño drier normal wetter drought flood none La Niña drier normal wetter drought flood none El Niño drier normal wetter drought flood none La Niña drier normal wetter drought flood none eastern Pacific (Central America & western South America) 8. Why do you think ENSO has global impacts? How could an ocean surface anomaly in the tropical Pacific incite variations in other parts of the world? 9. If ENSO events became more frequent, what would happen to ecosystems and economies in locations subject to these weather variations, both in the tropical Pacific and around the world?
