330HW07 long run prod+
advertisement
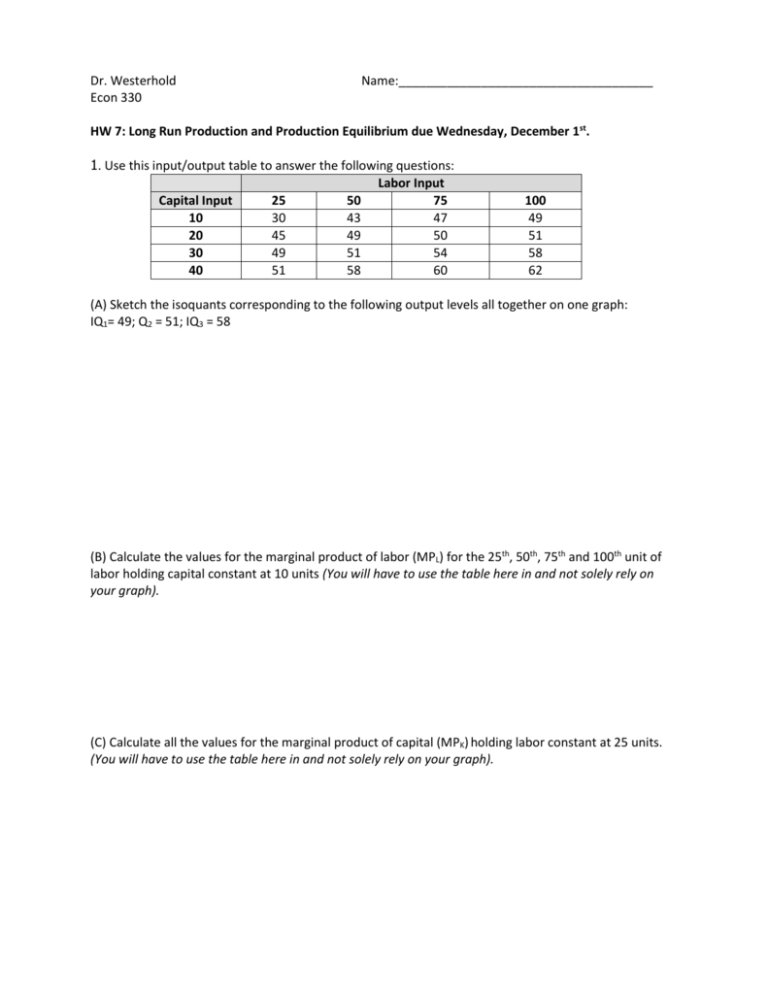
Dr. Westerhold Econ 330 Name:_____________________________________ HW 7: Long Run Production and Production Equilibrium due Wednesday, December 1st. 1. Use this input/output table to answer the following questions: Labor Input Capital Input 25 50 75 10 30 43 47 20 45 49 50 30 49 51 54 40 51 58 60 100 49 51 58 62 (A) Sketch the isoquants corresponding to the following output levels all together on one graph: IQ1= 49; Q2 = 51; IQ3 = 58 (B) Calculate the values for the marginal product of labor (MPL) for the 25th, 50th, 75th and 100th unit of labor holding capital constant at 10 units (You will have to use the table here in and not solely rely on your graph). (C) Calculate all the values for the marginal product of capital (MPK) holding labor constant at 25 units. (You will have to use the table here in and not solely rely on your graph). D) Given your answers to part B and C, does the production function exhibit diminishing marginal returns to labor and to capital? Briefly explain. E) Analyze the pattern of marginal rate of technical substitution (MRTS) along IQ1=49 between the different points on your isoquant (e.g. A to B and B to C). Is the MRTS increasing, decreasing, or constant? Show your work. Is this what you expected? Why or why not? F) Interpret your second MRTS number (B to C) in terms of what it means about the substitutability of inputs and relative productivity of inputs (Interpret slope in both ways). G) What returns to scale does the production function exhibit over the range of output provided in the table. (Calculate the % change in inputs and the corresponding % change in output for each input level pair down the diagonal of the table then classify each pairing as constant, increasing, or decreasing returns to scale). Questions 2-3: Do the following production functions exhibit Constant Returns to Scale, Decreasing Returns to Scale, or Increasing Returns to Scale? Why? Show your work for full credit including the %L, K and %Q. Where appropriate you can use the Cobb-Douglas rule as a check of your work (but it is not a substitute for calculating the numbers). 2) Q=L0.35 + 2K 0.25 Assume L=20 and K=80. Solve for a 12% increase in all inputs. 3) Q=10(L0.2K0.8) Assume L=40; K=60. Solve for a 20% increase in all inputs. 4. Which of the following production functions exhibit constant returns to scale? In each case y is output and K and L are inputs. (a) y = K0.5 L0.6. (b) y = 3K1.0/2L0.5. (c) y = K0.5 + L0.5. (d) y = 2K + 3L. 5. A firm has the production function f(x, y) = 20x0.6 y0.4. Calculate the slope of the firm’s isoquant at the point (x, y) = (20, 40). Interpret this number in terms of substitutability. Use the following production function to answer all parts to Question 6: Q=7.5L0.6K0.5 A) Starting with employment levels of labor and capital of L=25 and K=50 determine the impact on the quantity produced when both inputs are increased by 10%. Does the production function exhibit increasing, decreasing, or constant returns to scale? Show your work. You may use the Cobb Douglas rule, if applicable, to verify your answer. B) Derive the marginal productivity of labor, MPL , equation and holding capital constant at its current level determine the type of marginal returns to labor this production function exhibits between labor input of 25 and labor input of 30. You may use the Cobb Douglas rule, if applicable, to verify your answer. C) Derive the marginal productivity of capital, MPk ,equation and holding labor constant at its current level determine the type of marginal returns to capital this production function exhibits between capital input of 50 and capital input of 55. You may use the Cobb Douglas rule, if applicable, to verify your answer. D) Determine the marginal rate of technical substitution (MRTS) of this production function when the labor input is 25 units and capital input is 50 units. What does this tell you about the relative productivity of labor and capital at this employment level? 7. Suppose Q=4.5L0.25K.5 and that the firm’s budget or total cost is c= $10,000 and w=$20 and r=$50. A. Write out the total cost equation. B. Determine the optimal capital-labor ratio for this firm and the amount of capital and labor the firm should employ to maximize production. How much output will be produced? C. Show your firm’s situation graphically. D. Determine the new production equilibrium when the firm’s budget (total cost) increases to $13,000. E. Show the firm’s long run expansion path on your graph in part C. F. Show the firm’s short run expansion path on your graph in part C and determine the amount of labor the firm would employ to reach this production isoquant (produce the same quantity as done in the long run). G. What would it cost the firm to produce this quantity in the short run? Is this more or less expensive than production in the long run? Briefly explain. End of Assignment.
