Lamb Carcass Evaluation
advertisement
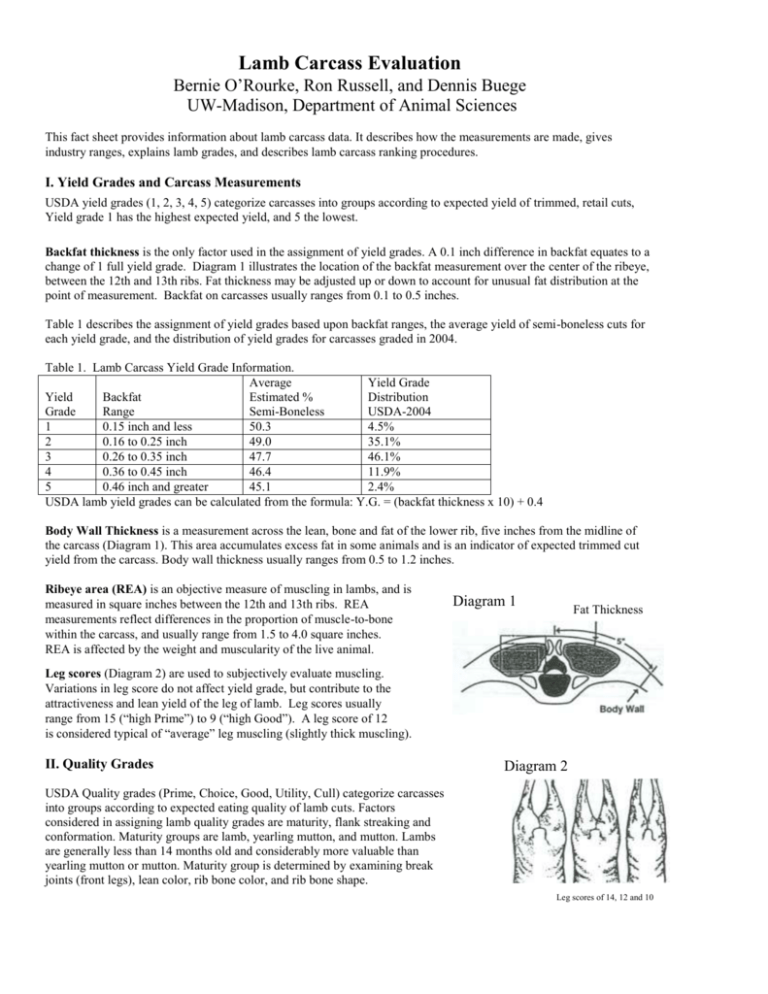
Lamb Carcass Evaluation Bernie O’Rourke, Ron Russell, and Dennis Buege UW-Madison, Department of Animal Sciences This fact sheet provides information about lamb carcass data. It describes how the measurements are made, gives industry ranges, explains lamb grades, and describes lamb carcass ranking procedures. I. Yield Grades and Carcass Measurements USDA yield grades (1, 2, 3, 4, 5) categorize carcasses into groups according to expected yield of trimmed, retail cuts, Yield grade 1 has the highest expected yield, and 5 the lowest. Backfat thickness is the only factor used in the assignment of yield grades. A 0.1 inch difference in backfat equates to a change of 1 full yield grade. Diagram 1 illustrates the location of the backfat measurement over the center of the ribeye, between the 12th and 13th ribs. Fat thickness may be adjusted up or down to account for unusual fat distribution at the point of measurement. Backfat on carcasses usually ranges from 0.1 to 0.5 inches. Table 1 describes the assignment of yield grades based upon backfat ranges, the average yield of semi-boneless cuts for each yield grade, and the distribution of yield grades for carcasses graded in 2004. Table 1. Lamb Carcass Yield Grade Information. Average Yield Grade Yield Backfat Estimated % Distribution Grade Range Semi-Boneless USDA-2004 1 0.15 inch and less 50.3 4.5% 2 0.16 to 0.25 inch 49.0 35.1% 3 0.26 to 0.35 inch 47.7 46.1% 4 0.36 to 0.45 inch 46.4 11.9% 5 0.46 inch and greater 45.1 2.4% USDA lamb yield grades can be calculated from the formula: Y.G. = (backfat thickness x 10) + 0.4 Body Wall Thickness is a measurement across the lean, bone and fat of the lower rib, five inches from the midline of the carcass (Diagram 1). This area accumulates excess fat in some animals and is an indicator of expected trimmed cut yield from the carcass. Body wall thickness usually ranges from 0.5 to 1.2 inches. Ribeye area (REA) is an objective measure of muscling in lambs, and is measured in square inches between the 12th and 13th ribs. REA measurements reflect differences in the proportion of muscle-to-bone within the carcass, and usually range from 1.5 to 4.0 square inches. REA is affected by the weight and muscularity of the live animal. Diagram 1 Fat Thickness Leg scores (Diagram 2) are used to subjectively evaluate muscling. Variations in leg score do not affect yield grade, but contribute to the attractiveness and lean yield of the leg of lamb. Leg scores usually range from 15 (“high Prime”) to 9 (“high Good”). A leg score of 12 is considered typical of “average” leg muscling (slightly thick muscling). II. Quality Grades Diagram 2 USDA Quality grades (Prime, Choice, Good, Utility, Cull) categorize carcasses into groups according to expected eating quality of lamb cuts. Factors considered in assigning lamb quality grades are maturity, flank streaking and conformation. Maturity groups are lamb, yearling mutton, and mutton. Lambs are generally less than 14 months old and considerably more valuable than yearling mutton or mutton. Maturity group is determined by examining break joints (front legs), lean color, rib bone color, and rib bone shape. Leg scores of 14, 12 and 10 Flank streaking is the quantity of fat deposited within and upon the inside flank muscles. This serves as an estimation of lean quality since lamb carcasses have not been traditionally ribbed to expose marbling in the ribeye. Conformation refers to the muscular development of the carcass and is largely determined by leg score. Although conformation (carcass shape) does not directly affect the eating quality of the lean, it can affect the appearance and acceptability of cuts from the carcass. 2004 USDA lamb carcass grading statistics reported that 6% of carcasses graded Prime, and 94% graded Choice. USDA reported values of 0.0% for the Good, Utility and Cull grades. Therefore virtually all carcasses fall into the equally acceptable top two grades. Carcasses have to be very underfinished and/or very poorly muscled to fall into the lower three grades. USDA lamb carcass grading is a voluntary action, chosen and paid for by the packer if its customers demand it. Carcasses designated for grading must have both the quality and yield grade applied. III. Lamb Carcass Index A lamb carcass index was developed to aid in ranking carcasses based upon overall desirability. The index is calculated from yield grade, ribeye area per carcass weight, body wall thickness and leg score (see Table 2). Top ranking carcasses must grade at least low choice and have a uniform minimum fat cover of 0.15 inch. Table 2. Lamb Carcass Index YG 2.0 2.2 2.4 2.6 2.8 3.0 etc. Base Carcass Index Weight 80 79 78 77 76 75 etc. Body Wall REA <50 lbs. 2.2 sq. in. 51-55 2.3 56-60 2.4 61-65 2.5 66-70 2.6 71-75 2.7 (+ 0.1 sq. in. = + 1 Index Unit) (- 0.1 sq. in. = - 1 Index Unit) Thickness Leg Score Base = 0.8 in. Base = 12 leg score (+ 0.1 in. = - 2 units) (- 0.1 in. = + 2 units) (+1 leg score = +1 unit) (-1 leg score = -1 unit) IV. Percent Boneless Closely Trimmed Retail Cuts (% BCTRC) This is an estimate of the yield of boneless, trimmed product from a lamb carcass. Carcasses normally range from 43 to 50% BCTRC. This estimate can be used to help rank carcasses. It is calculated from carcass weight, backfat thickness, body wall thickness, and ribeye area, by making adjustments from a starting "base" carcass (see Table 3). Table 3. Lamb Carcass % BCTRC Base Carcass Carcass Weight Fat Thickness 47% BCTRC 60# 0.2 in. + 10# = - 1% + 0.1 in. = - 0.5% - 10# = +1% - 0.1 in. = + 0.5% Body Wall Thickness 0.8 in. +0.1 in. = - 0.4% - 0.1 in. = + 0.4% Loin Muscle Area 2.4 sq. in. + 0.1 sq. in. = + 0.3% - 0.1 sq. in. = - 0.3% It is recommended that top placing lambs carcasses (blue group) meet these minimum criteria: Carcass weight: 60 pounds or higher Fat thickness: minimum 0.15 inch (adequate fat cover) Ribeye area: 2.2 square inches or more Leg Score: 12 or higher Quality Grade: Choice or Prime “Lamb2.doc” C:Carcass Evaluations 6-23-05
