Resistance Investigation Mark Scheme
advertisement
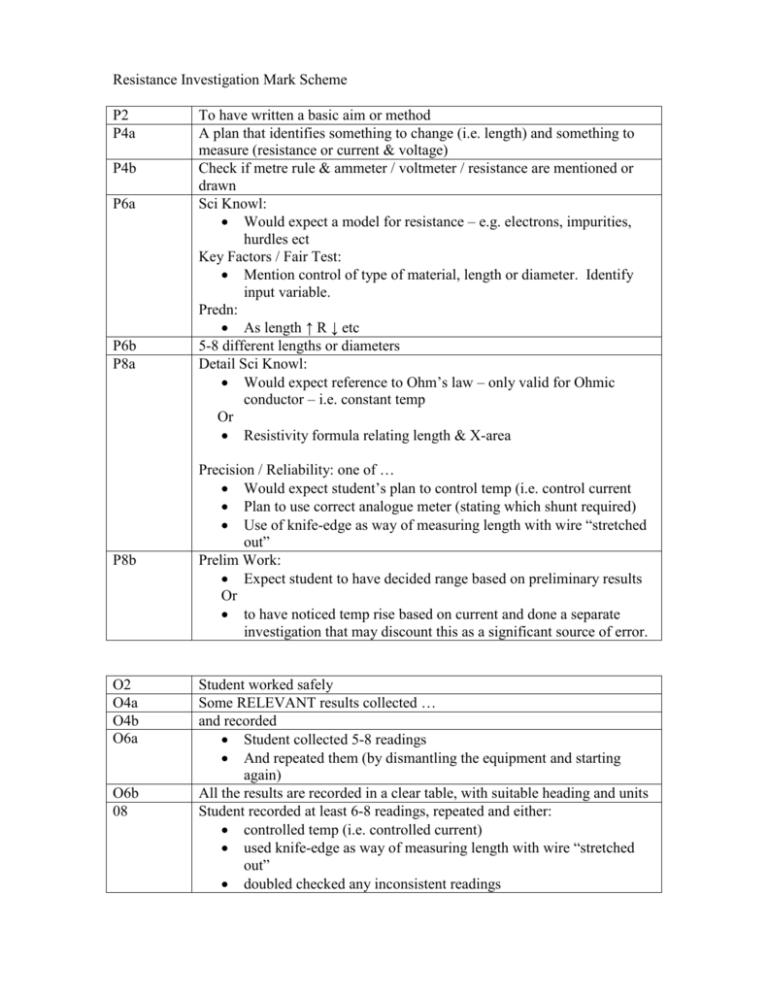
Resistance Investigation Mark Scheme P2 P4a P4b P6a P6b P8a P8b O2 O4a O4b O6a O6b 08 To have written a basic aim or method A plan that identifies something to change (i.e. length) and something to measure (resistance or current & voltage) Check if metre rule & ammeter / voltmeter / resistance are mentioned or drawn Sci Knowl: Would expect a model for resistance – e.g. electrons, impurities, hurdles ect Key Factors / Fair Test: Mention control of type of material, length or diameter. Identify input variable. Predn: As length ↑ R ↓ etc 5-8 different lengths or diameters Detail Sci Knowl: Would expect reference to Ohm’s law – only valid for Ohmic conductor – i.e. constant temp Or Resistivity formula relating length & X-area Precision / Reliability: one of … Would expect student’s plan to control temp (i.e. control current Plan to use correct analogue meter (stating which shunt required) Use of knife-edge as way of measuring length with wire “stretched out” Prelim Work: Expect student to have decided range based on preliminary results Or to have noticed temp rise based on current and done a separate investigation that may discount this as a significant source of error. Student worked safely Some RELEVANT results collected … and recorded Student collected 5-8 readings And repeated them (by dismantling the equipment and starting again) All the results are recorded in a clear table, with suitable heading and units Student recorded at least 6-8 readings, repeated and either: controlled temp (i.e. controlled current) used knife-edge as way of measuring length with wire “stretched out” doubled checked any inconsistent readings A2 A4a A4b A6a A6b A8a A8b E2a E4a E4b E6a E6b Simple conclusion (doesn’t need to be right) Drawn a simple graph of R or I against length or diameter Stated simply that as L increases so does R (or something consistent for diameter) Graph required that has: axes and units labelled drawn covering at least ¾ of the paper sharp pencil line of best fit Written a consistent conclusion – that covers A4b but matches this to the graph And Explained this using the Sci Knowl expected in P6a Used a model for resistance to explain the results based on having calculated a set of resistances from V/I data Mentioned the effect of temp (or the inability to control it) or other systematic errors as a note of caution in assuming Ohm’s law – could find this in the “evaluation” Some comment under a title “evaluation” that goes beyond “it went well” – based on the procedure or evidence Comment on the results – identifying anomalies – could just be circles on the graph – or a statement suggesting that there weren’t any Comment on the procedure in terms of suitability – and an attempt made to find suggestions for improvement A critical study of the results and graph is required in which anomalous results are accounted for – this could be a continuation of the discussion about Ohms law only valid at constant temp. Detailed description required about how we could remove or discount the variance in temp as a source of error. A good further investigation could be to repeat the whole experiment with the same swg wire from another reel or company and see if there are discrepancies in the results. Good students may have researched resistivity and would want to compare their process with published data.
