Table 1: Frequency of contact with LFP patients
advertisement
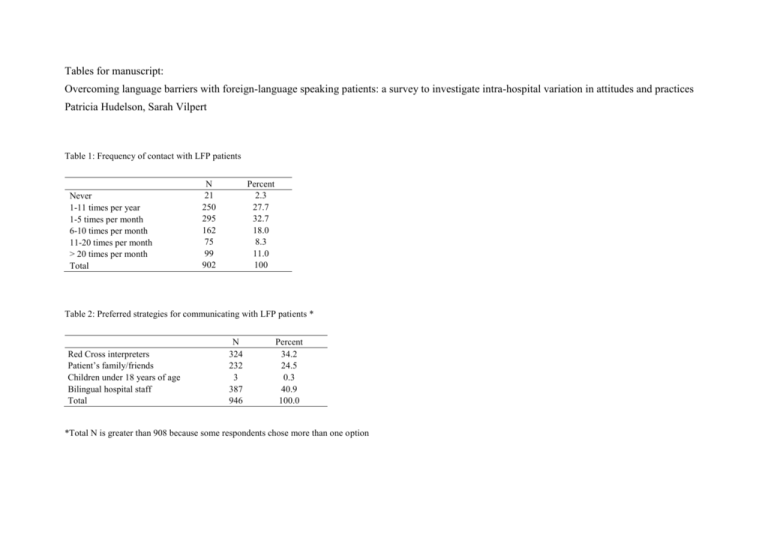
Tables for manuscript: Overcoming language barriers with foreign-language speaking patients: a survey to investigate intra-hospital variation in attitudes and practices Patricia Hudelson, Sarah Vilpert Table 1: Frequency of contact with LFP patients Never 1-11 times per year 1-5 times per month 6-10 times per month 11-20 times per month > 20 times per month Total N 21 250 295 162 75 99 902 Percent 2.3 27.7 32.7 18.0 8.3 11.0 100 Table 2: Preferred strategies for communicating with LFP patients * Red Cross interpreters Patient’s family/friends Children under 18 years of age Bilingual hospital staff Total N 324 232 3 387 946 Percent 34.2 24.5 0.3 40.9 100.0 *Total N is greater than 908 because some respondents chose more than one option Table 3: Language strategy preferences by department Surgery Child and Adolescent Health Gynecology and Obstetrics Community Medicine and Primary Care Genetic Medicine and Laboratory Internal Medicine Clinical Neurosciences Psychiatry Rehabilitation and Geriatrics 15 (16.67%) 16 (17%) 68 (50%) 14 (45%) 43 (60%) 4 (20%) 38 (28%) 10 (17%) 93 (56%) Patient's family/ friends 28 (31%) 37 (39%) 18 (13%) 6 (19%) 13 (18%) 6 (30%) 43 (32%) 25 (42%) Bilingual hospital staff 48 (53%) 44 (46%) 54 (39%) 11 (35%) 18 (25%) 10 (50%) 59 (43%) 28 (47%) Language strategy preferred GRC interpreters Anesthesiology/ Pharmacology/ Intensive Care χ2 p< V 23 (23%) 112.621 0.000 0.352 21 (13%) 34 (33%) 53.518 0.000 0.243 62 (37%) 52 (51%) 20.862 0.013 0.152 Table 4: Use of GRC interpreters during previous 6 months, by department Use of GRC interpreters during previous 6 months Anesthesiology/ Pharmacology/ Intensive Care Surgery Child and Adolescent Health Gynecology and Obstetrics Community Medicine and Primary Care Genetic Medicine and Laboratory Internal Medicine Clinical Neurosciences Psychiatry Rehabilitation and Geriatrics Never 57 (74% 61 (69%) 34 (26% 4 (15% 22 (33% 10 (59% 63 (50%) 28 (53%) 48 (33%) 70 (85% 1-5 times 19 (25% 26 (29% 74 (57% 15 (58% 24 (36% 6 (35% 53 (42% 22 (42%) 72 (50%) 10 (12% 6 and more 1 (1% 2 (2% 22 (17% 7 (27% 21 (31% 1 (6%) 9 (7%) 3 (5%) 25 (17%) 2 (2% χ2 = 168.523; p < 0,000; dl 18 λ = 0.186, dependent variable "Use of GRC interpreters during previous 6 months" V = 0,322; P < 0,000 Table 5: Percent of respondents having received training in how to work with an interpreter Training Yes No Total N Doctor 14.3 % 85.7 392 Nurse 4.5% 95.5 443 Social worker 13.2% 86.8 68 χ2 = 24.546 ; p < 0,000 ; dl 2 V = 0,165 ; P < 0,000 Table 6: Training in how/why to use an interpreter by department Received training Yes No TOTAL N Anesthesiology/ Pharmacology/ Intensive Care Surgery Child and Adolescent Health Gynecology and Obstetrics Community Medicine and Primary Care Genetic Medicine and Laboratory Internal Medicine Clinical Neurosciences Psychiatry Rehabilitation and Geriatrics 2 (2%) 3 (3%) 13 (10%) 1 (3%) 27 (38%) 0 9 (7%) 3 (5%) 24 (15%) 3 (3%) 88 (98%) 92 (97%) 122 (90%) 30 (97%) 45 (63%) 20 (100%) 126 (93%) 56 (95%) 141 (85%) 97 (97%) 90 95 135 31 72 20 135 59 165 100 Table 7: Respondents’ reports of messages to staff about interpreter use, by department Anesthesiology/Pharmacology/ Intensive Care Surgery Child and Adolescent Health Gynecology and Obstetrics Community Medicine and Primary Care Genetic Medicine and Laboratory Internal Medicine Clinical Neurosciences Psychiatry Rehabilitation and Geriatrics Encourages use of GRC interpreters 4 (5%) 4 (4%) 59 (44%) 5 (16%) 38 (56%) 1 (5%) 19 (14%) 6 (11%) 63 (39%) 7 (7%) Encourages use of alternative strategies 9 (10%) 14 (15) 12 (9%) 5 (16%) 5 (7%) 0 12 (9%) 3 (5%) 33 (21%) 13 (13%) Provides no guidance 74 (85%) 76 (81) 64 (47%) 21(68%) 25 (37%) 19 (95%) 105 (77%) 48 (84%) 64 (40%) 78 (78%) Total N 87 94 135 31 68 20 136 57 160 98 Message to staff Table 8: Respondents’ opinions about use of GRC interpreters by service-level policy concerning communication with LFP patients Service Opinion about use of GRC interpreters Systematically In some situation Only when no other solution Total % (N) χ2 = 70,517; p < 0,000 ; dl 4 V = 0,202 ; P < 0,000 Encourages GRC use 40.3% 45.3 14.4 100 201 Discourages GRC use 15.5% 39.8 44.7 100 103 Provides no guidance 16.2% 47.1 36.7 100 556 Table 9: GRC interpreter use by service-level policy about communication with LFP patients Service Use of GRC interpreters during last 6 months Never 1-10 times 11+ times Total % (N) Encourages GRC use 13.2% 72.6 14.2 100 197 Discourages GRC use 57.5% 42.5 0.0 100 87 χ2 = 153,696; p < 0,000 ; dl 4 λ = 0.285, dependent variable "Use of GRC interpreters during previous 6 months" V = 0,310 ; P < 0,000 Provides no guidance 60.7% 37.2 2.1 100 514
