Key Concepts
advertisement
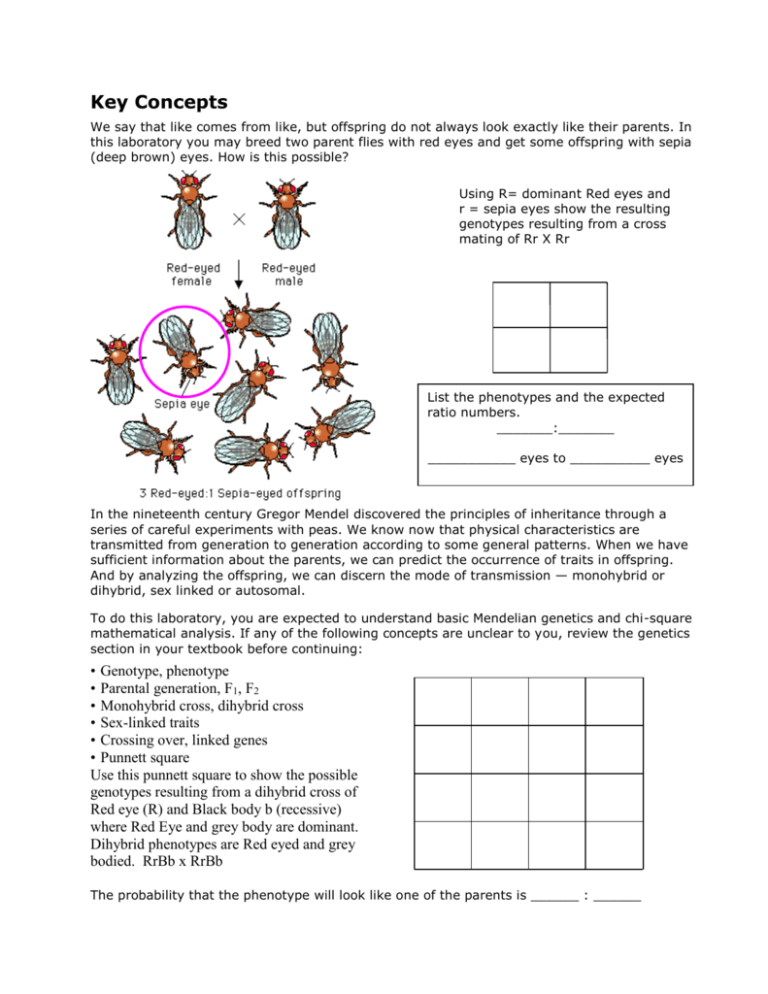
Key Concepts We say that like comes from like, but offspring do not always look exactly like their parents. In this laboratory you may breed two parent flies with red eyes and get some offspring with sepia (deep brown) eyes. How is this possible? Using R= dominant Red eyes and r = sepia eyes show the resulting genotypes resulting from a cross mating of Rr X Rr List the phenotypes and the expected ratio numbers. _______:_______ ___________ eyes to __________ eyes In the nineteenth century Gregor Mendel discovered the principles of inheritance through a series of careful experiments with peas. We know now that physical characteristics are transmitted from generation to generation according to some general patterns. When we have sufficient information about the parents, we can predict the occurrence of traits in offspring. And by analyzing the offspring, we can discern the mode of transmission — monohybrid or dihybrid, sex linked or autosomal. To do this laboratory, you are expected to understand basic Mendelian genetics and chi-square mathematical analysis. If any of the following concepts are unclear to you, review the genetics section in your textbook before continuing: • Genotype, phenotype • Parental generation, F1, F2 • Monohybrid cross, dihybrid cross • Sex-linked traits • Crossing over, linked genes • Punnett square Use this punnett square to show the possible genotypes resulting from a dihybrid cross of Red eye (R) and Black body b (recessive) where Red Eye and grey body are dominant. Dihybrid phenotypes are Red eyed and grey bodied. RrBb x RrBb The probability that the phenotype will look like one of the parents is ______ : ______ 2 Design of the Experiment How to Tell the Males from the Females The first thing you must do in this laboratory is learn to distinguish male fruit flies from female fruit flies. As illustrated in the figures above, female flies generally have a long, pointed, lightly striped abdomen. The male abdomen, by contrast, is blunt and darker. Very young flies may not show this clear difference, so for more certain sex identification you should look for sex combs, dark bristles found on the inner surface of the forelimbs. Only males have sex combs. In the following exercise you practice determining the sex of fruit flies. For each fly, select male or female in the appropriate box below. Newly emerged flies may be hard to sex from the abdomen alone. In such cases, look at the legs. Fly A 1. Is fly "A" male or female? Fly B 2. Is fly "B" male or female? Answer: ______________________ Answer: ______________________ http://www.phschool.com/science/biology_place/labbench/lab7/calcchi.html 3 Fly C 3. Is fly "C" male or female? Answer: ______________________ Fly D 4. Is fly "D" male or female? Answer: ______________________ Fly E 5. Is fly "E" male or female? Answer: ______________________ http://www.phschool.com/science/biology_place/labbench/lab7/calcchi.html 4 Overview of the Experiment Following the directions in your lab manual or your instructor's directions, over a period of four weeks you will study three generations of flies. You begin with a parental (P) generation that has already mated. The figure below gives you an overview of the procedures you will follow; you may want to print it so you can refer to it through the rest of the lab. Once you've studied the overview figure, continue to see more details of the different stages of the experiment on the succeeding pages. The following pages will give you a more detailed understanding of the experiment. http://www.phschool.com/science/biology_place/labbench/lab7/calcchi.html 5 Parental Generation Week One Your instructor will give you a vial containing both male and female flies. This is the parental generation. Study them carefully with a dissecting microscope or lens. Some of your flies will be of the wild type (showing the normal phenotype) and others may show various mutations (genetic variations from the wild type), such as those illustrated below. When eggs and larvae appear, remove the adult flies from the vial. Why is it important to remove the adults? F1 and F2 Generations Weeks Two Through Four The flies that hatched from the initial vial are the F1 generation. Immobilize and carefully observe these flies. Note and record any genetic variations. HINT: Be sure to separate males from females to see if there are variations related to sex. Set up a new vial and transfer some of the F1 flies to it. What generation will their offspring be? Analysis of Results In the laboratory you breed your flies and analyze the results of the breeding through the F2 generation. The exercises below are designed to help you understand the patterns of inheritance in your fly populations. 1. Reversing the Procedure One way to discover patterns of inheritance is by working backward. In other words, you determine the genotype of the original parental generation by careful analysis of the F 1 and F2 generations. Let's examine two sample cases that trace eye color. For each, look at the data chart with the number of male and female flies exhibiting each eye color. Then answer the questions. http://www.phschool.com/science/biology_place/labbench/lab7/calcchi.html 6 Case 1 The ratio of totals in this case is __________ : __________ Red eyes : sepia eyes Based on the data obtained, is this cross: a. monohybrid b. dihybrid Is the cross: a. sex-linked b. autosomal Let's look at one more example of data that might be obtained from this experiment. http://www.phschool.com/science/biology_place/labbench/lab7/calcchi.html 7 Case 2 Based on the data obtained, which is the most likely mode of interitance in Case 2? a. autosomal b. sex-linked From the data presented, determine the genotype of the parental (before the F1 generation; not shown here) generation. + = wild type (red eyes) w = white eyes a. X+X+ x X+Y b. X+Xw x X+Y c. X+X+ x XwY d. XwXw x XwY http://www.phschool.com/science/biology_place/labbench/lab7/calcchi.html 8 Chi-Square Analysis of Data Look at the tables you printed from Case 1. From the data presented, you can deduce that the F1 cross was between individuals heterozygous for eye color: +se x +se (+ = red; se = sepia ). From this conclusion, you could write the following hypothesis: "If the parents are heterozygous for eye color, there will be a 3:1 ratio of red eyes to sepia eyes in the offspring." Do your results support this hypothesis? The actual results of an experiment are unlikely to match the expected results precisely. But how great a variance is significant? One way to decide is to use the chi-square (x2) test. This analytical tool tests the validity of a null hypothesis, which states that there is no statistically significant difference between the observed results of your experiment and the expected results. When there is little difference between the observed results and the expected results, you obtain a very low chi-square value; your hypothesis is supported. Next we'll see how to calculate and interpret chi-square. If you would like some help on calculating expected results first, take a side trip before continuing. How to Calculate the Expected Value In a cross between two heterozygous individuals, the offspring would be expected to show a 3 : 1 ratio. For example, in Case 1, three-fourths of the individuals would have red (wild-type) eyes, and one-fourth would have sepia eyes. If there are 44 offspring, how many are expected to have red eyes? We expect three-fourths to have red eyes. If there are 44 offspring, how many are expected to have sepia eyes? Now you are ready to calculate chi-square. Calculating Chi-Square The formula for chi-square is: X2 = the sum of ( o e) 2 e where: o = observed number of individuals, and e = expected number of individuals Using the data from Case 1, complete this table: Phenotype Observed (o) Expected (e) (o-e) 2 (o-e) ( o e) 2 e Red Eyes Sepia Eyes Using the Chi-Square Critical Values Table The chi-square critical values table provides two values that you need to calculate X2 = chi-square: http://www.phschool.com/science/biology_place/labbench/lab7/calcchi.html 9 • Degrees of freedom. This number is one less than the total number of classes of offspring in a cross. In a monohybrid cross, such as our Case 1, there are two classes of offspring (red eyes and sepia eyes). Therefore, there is just one degree of freedom. In a dihybrid cross, there are four possible classes of offspring, so there are three degrees of freedom. • Probability. The probability value (p) is the probability that a deviation as great as or greater than each chi-square value would occur simply by chance. Many biologists agree that deviations having a chance probability greater than 0.05 (5%) are not statistically significant. Therefore, when you calculate chi-square you should consult the table for the p value in the 0.05 row. Use the critical values table here to do the problems below. * Degrees of Freedom (df) Probability (p) 1 2 3 4 5 0.05 3.84 5.99 7.82 9.49 11.1 0.01 6.64 9.21 11.3 13.2 15.1 0.001 10.8 13.8 16.3 18.5 20.5 1. Determine the degrees of freedom. This is the number of categories (red eyes or sepia eyes) minus one. For the data in Case 1, the number of degrees of freedom is 2. Find the probability (p) value for 1 degree of freedom in the 0.05 row. http://www.phschool.com/science/biology_place/labbench/lab7/calcchi.html 10 Lab Quiz 1. On the basis of the results shown in the table, which statement is most likely true? a. The genes for red eyes and normal wings are linked. b. The gene for no wings is sex-linked. c. The gene for red eyes and the gene for no wings are both dominant. d. The gene for eye color is inherited independently of the gene for wings. e. The F1 mates were both homozygous for both eye color and wings. 2. If the parents were both heterozygous for eye color and wings, what phenotypic ratio would you predict for the offspring if these traits are not linked? http://www.phschool.com/science/biology_place/labbench/lab7/calcchi.html 11 a. 1 red eyes/no wings 1 red eyes/normal wings 1 sepia eyes/normal wings 1 sepia eyes/no wings b. 9 red eyes/normal wings 3 red eyes/no wings 3 sepia eyes/normal wings 1 sepia eyes/no wings c. 3 red eyes/normal wings 1 sepia eyes/no wings d. 1 red eyes/normal wings 2 sepia eyes/normal wings 1 red eyes/no wings 2 sepia eyes/no wings 3. Based on the hypothesis that this is a dihybrid cross, with the two genes unlinked, calculate X2 using the data in the table of observed phenotypes. a. 6.04 b. 7.81 c. 4.977 d. 24.0 Phenotype Observed (o) Expected (e) (o-e) 2 (o-e) Red Eyes w/ Wings Red Eyes w/o Wings Sepia Eyes w/ Wings Sepia Eyes w/o Wings X2 = http://www.phschool.com/science/biology_place/labbench/lab7/calcchi.html ( o e) 2 e 12 4. How many degrees of freedom are there for these data a. 1 b. 2 c. 3 d. 4 5. Compare the chi-square value obtained in Question 3 with the Critical Values Table below for p = 0.05. Which of the following statements would be true? Degrees of freedom (df) 2 3 4 5 Probability (p) 1 0.05 3.84 5.99 7.82 9.49 11.1 0.01 6.64 9.21 11.3 13.2 15.1 0.001 10.8 13.8 16.3 18.5 20.5 a. Since the calculated value for chi-square is less than 7.82, the results support the hypothesis that the parents are heterozygous for two unlinked traits. b. Since the calculated value for chi-square is less than 7.82, the results support the hypothesis that eye color and wings are linked. c. Since the calculated value for chi-square is less than 7.82, the results are inconclusive. The experiment should be repeated. d. Since the calculated value for chi-square is so large, the variations from the expected are excessive. The experiment should be repeated. http://www.phschool.com/science/biology_place/labbench/lab7/calcchi.html 13 Answers 1. d Correct! There is no evidence for any type of linkage, since both males and females show the traits in approximately equal proportions, and eye color and wings appear to sort independently. If the parents were homozygous for these traits, the offspring would not show different phenotypes from both parents. 2. b Correct! If there were linkage, choice a would be correct, but when two traits sort independently, the offspring of heterozygous parents will show the traits in a 9:3:3:1 ratio. 3. a. Sorry. The correct answer is c. This is obtained by using the formula X2 = the sum of 4. Sorry. The correct answer is c. There are 4 categories minus 1 = 3 degrees of freedom. 5. a Correct! The expected results are based on obtaining a 9:3:3:1 ratio from two heterozygous parents. Since the chi-square value is below 7.82, the results are statistically significant. http://www.phschool.com/science/biology_place/labbench/lab7/calcchi.html
