Faroe_plateau_ecosystem_overview
advertisement
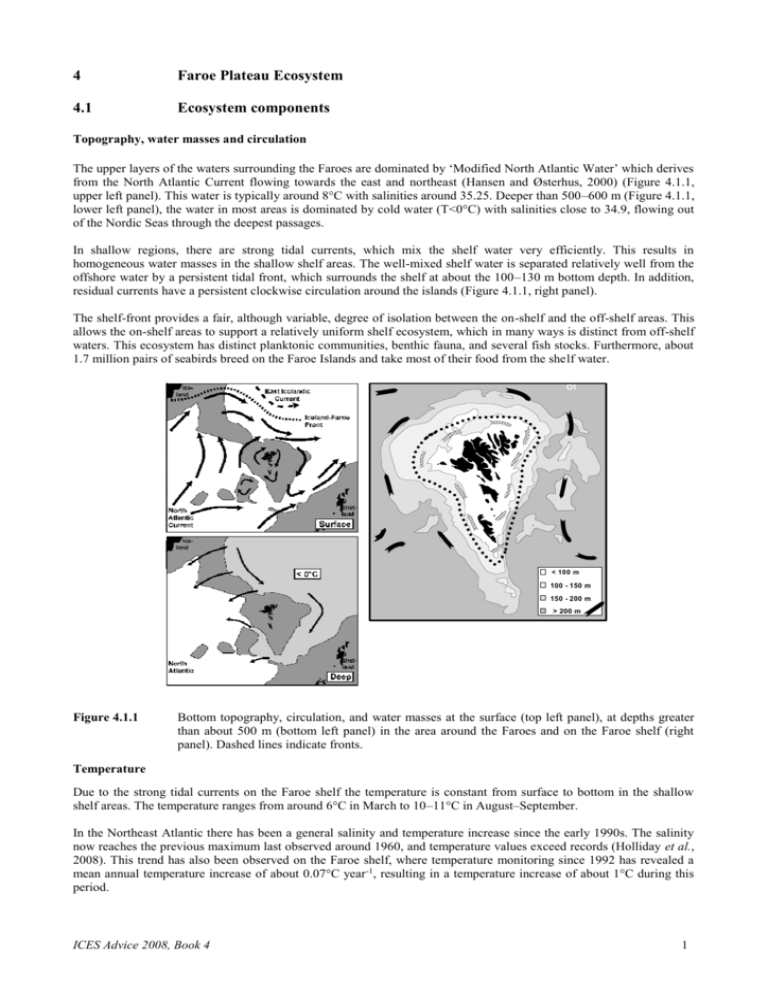
4 Faroe Plateau Ecosystem 4.1 Ecosystem components Topography, water masses and circulation The upper layers of the waters surrounding the Faroes are dominated by ‘Modified North Atlantic Water’ which derives from the North Atlantic Current flowing towards the east and northeast (Hansen and Østerhus, 2000) (Figure 4.1.1, upper left panel). This water is typically around 8°C with salinities around 35.25. Deeper than 500–600 m (Figure 4.1.1, lower left panel), the water in most areas is dominated by cold water (T<0°C) with salinities close to 34.9, flowing out of the Nordic Seas through the deepest passages. In shallow regions, there are strong tidal currents, which mix the shelf water very efficiently. This results in homogeneous water masses in the shallow shelf areas. The well-mixed shelf water is separated relatively well from the offshore water by a persistent tidal front, which surrounds the shelf at about the 100–130 m bottom depth. In addition, residual currents have a persistent clockwise circulation around the islands (Figure 4.1.1, right panel). The shelf-front provides a fair, although variable, degree of isolation between the on-shelf and the off-shelf areas. This allows the on-shelf areas to support a relatively uniform shelf ecosystem, which in many ways is distinct from off-shelf waters. This ecosystem has distinct planktonic communities, benthic fauna, and several fish stocks. Furthermore, about 1.7 million pairs of seabirds breed on the Faroe Islands and take most of their food from the shelf water. O1 < 100 m 100 - 150 m 150 - 200 m > 200 m Figure 4.1.1 Bottom topography, circulation, and water masses at the surface (top left panel), at depths greater than about 500 m (bottom left panel) in the area around the Faroes and on the Faroe shelf (right panel). Dashed lines indicate fronts. Temperature Due to the strong tidal currents on the Faroe shelf the temperature is constant from surface to bottom in the shallow shelf areas. The temperature ranges from around 6°C in March to 10–11°C in August–September. In the Northeast Atlantic there has been a general salinity and temperature increase since the early 1990s. The salinity now reaches the previous maximum last observed around 1960, and temperature values exceed records (Holliday et al., 2008). This trend has also been observed on the Faroe shelf, where temperature monitoring since 1992 has revealed a mean annual temperature increase of about 0.07°C year -1, resulting in a temperature increase of about 1°C during this period. ICES Advice 2008, Book 4 1 Temperature (°C) 9,0 8,5 8,0 7,5 7,0 1990 Figure 4.1.2 1995 2000 2005 Mean annual temperature on the Faroe shelf, 1992–2007. Phytoplankton The three oceanographic regimes (well-mixed shelf, frontal, and stratified off-shelf) offer different conditions for primary production. While the shallow well-mixed part is relatively well studied, little is known about production cycles and their dependence on environmental conditions in the two other regimes in the region. One distinguishing feature is the typical earlier spring bloom on the shelf than off the shelf. However, timing and intensity of the bloom can vary greatly from one year to another. This variability has pronounced effects on the ecosystem. Most of the primary production usually takes place from May to August. The timing of the onset of primary production in spring is, however, highly variably between years (Figure 4.1.3). This variability affects production of food for fish larvae in spring (Gaard 2003; Debes et al., 2005; Debes and Eliasen, 2006), which mainly consists of copepod eggs and nauplii and small copepodites (Gaard and Steingrund, 2001; Nielsen, 2007). The phytoplankton on the Faroe shelf consists mainly of diatoms during spring and summer. However, during periods with low nutrient concentrations smaller flagellates may be relatively more abundant (Gaard et al., 1998; Debes et al., 2007a). In 2007 the biomass increase occurred in early spring. However, it decreased already in the beginning of June and remained low for the rest of the season. 12 1997 1998 Chlorophyll a (µg l-1) 10 1999 8 2000 2001 6 2002 2003 4 2004 2005 2 2006 2007 0 J Figure 4.1.3 2 F M A M J J Month A S O N D Chlorophyll a concentrations on the central shelf, 1997–2007. ICES Advice 2008, Book 4 The mean annual primary production on the shelf is around 160–200 g C m−2 of which about 50% is estimated to be new production (Debes et al., 2007a). There is a very high interannual variability primary production (Gaard, 2003; Eliasen et al., 2005), and from 1990 to 2007 the new primary production (from spring to mid-summer) has fluctuated by a factor ~5 (Figure 4.1.4). The index for 2007 was slightly below the 1990–2007 average and has been so for the last three years. Except in 2004 the phytoplankton production index has been below average since 2002 (Figure 4.1.4). 20 PPnew index 15 10 5 0 1990 Figure 4.1.4 1995 2000 2005 Index of new primary production from spring to mid-summer on the Faroe shelf since 1990. The horizontal line represents the average index in the period 1990–2007. The main reasons for the high interannual variability in timing and intensity of primary production on the shelf seem to be hydrographical. Modelling (Eliasen et al., 2005; Hansen et al., 2005) and field studies (Debes et al., 2007a) indicate that variable exchange rates between on-shelf and off-shelf waters, causing loss of phytoplankton from the shelf, may be a main controlling factor for biomass increase and the primary production. The variability in primary production between years (Figure 4.1.4) highly affects production in higher trophic levels in the ecosystem. The primary production is identified as the main driver for biological productivity in the in the shelf ecosystem, including fish and seabirds (Gaard et al., 2002, 2006; Steingrund and Gaard, 2005). Below are described observed effects on fish growth, recruitment and production, behaviour, and catchability. Primary production variability can thus be used as the first indicator for productive status in the system ~1 year ahead. Zooplankton While the zooplankton community outside the shelf front is largely dominated by the copepod Calanus finmarchicus, the shelf zooplankton community is basically neritic (shelf-related species). During spring and summer the zooplankton in the shelf water is largely dominated by the copepods Temora longicornis and Acartia longiremis. C. finmarchicus is advected from off-shelf and occurs in the shelf water in highly variable abundance between years. Usually the abundance of C. finmarchicus is highest in spring and early summer. Meroplanktonic larvae (mainly barnacle larvae) may also be abundant, and decapod larvae and fish larvae and juveniles are common on the Shelf during spring and summer (Gaard 1999, 2003; Debes and Eliasen, 2006). Reproduction rates of copepods depend largely on their feeding conditions and co-occurring fluctuations have been observed between phytoplankton timing and abundance, and copepod egg production rates, abundance, and composition (Gaard, 1999; Debes et al., 2005, 2008b). This variability affects feeding conditions for fish larvae and pelagic juveniles in general on the shelf (Gaard and Steingrund, 2001; Gaard and Reinert, 2002; Kristiansen, 2007; Nielsen, 2007). Fish community A total of about 240 fish species are recorded in Faroese waters. Most of these species are, however, rare and are not exploited. The number of commercially exploited species on the Faroe Plateau is about 25. An overview of typical depth distribution of the main species in offshore and shelf areas (deeper than 65 m bottom depth) is shown in Figure 4.1.5. Most of these species spawn locally; however, some species (e.g. redfish and Greenland halibut) have their spawning grounds outside the Faroese area and are apparently common stocks in large parts of the Northeast Atlantic. ICES Advice 2008, Book 4 3 Figure 4.1.5 Typical depth distribution of fish in areas deeper than ~65 m on the Faroe shelf and in the ocean around the Faroes. Of pelagic fish blue whiting is the most abundant. After spawning to the west of the British Isles in early spring, they start their feeding migration further north into the Norwegian Sea. They usually enter the Faroe eco-region in late April. They feed mainly on krill, amphipods, and other large zooplankton at depths between 300 and 500 meters, and partly also on the copepod Calanus finmarchicus closer to the surface. In late summer and autumn mature individuals migrate southwards again towards the spawning area while juveniles stay in Faroese water and the Norwegian Sea. Mackerel make a similar migration, although they have a more easterly and shallower distribution. Their main food items are C. finmarchicus and krill. Norwegian spring-spawning herring may migrate after spawning on the Norwegian shelf in March into the northernmost part of the Faroe eco-region to feed. Later the herring distribution is further north in the Norwegian Sea. Cod and haddock and saithe are the most commercially important demersal stocks in Faroese waters. Their spawning takes place on the shelf in spring. The saithe spawns mainly in the northeastern and northern part of the shelf slope in February–March, and the offspring is found close to the shores already in May. At an age of about 3 years they migrate into deep habitats, mainly on the upper slope. Cod spawns in the northern and western part of the shelf, mainly in March. The spawning grounds of the haddock are more disperse than those of cod and saithe and spawning takes place mainly in April. Their offspring is dispersed by the strong currents throughout the shelf area where they feed, mainly on copepods and decapod larvae (Gaard and Steingrund, 2001; Gaard and Reinert, 2002). In July, at lengths of about 4 cm, the cod juveniles migrate into shallow areas close to shore, while the haddock make the transition to a predominantly demersal habitat on the plateau and the banks at depths of 90–200 m. At an age of 1–2 years cod starts its migration to deeper areas on the shelf. Two ecologically important fish species in the ecosystem are sandeel and Norway pout. After spawning in spring their offspring too is dispersed by the tidal currents throughout the shelf area where they feed on zooplankton. Both species are important food items for seabirds and demersal fish on the shelf and the upper slope, and are important links between zooplankton and higher trophic levels. Especially sandeels occur in variable abundances between years. Neither of these two species is commercially exploited. Detailed knowledge about variability in food consumption of demersal cod, haddock and saithe in Faroese waters is not conclusive. Saithe feeds on the shelf slope largely on fish (mainly blue whiting and Norway pout) with smaller amounts of krill added to their diet. Cod and haddock show higher diversity in prey items, and predate on benthic fauna as well as fish, with fish being a more prevalent prey item for cod than for haddock. Of the fish prey, sandeel appear to be a key species in the shallow areas. When abundant they are a preferred food item for cod on the shelf and hence, already as 0group sandeels, affecting the feeding conditions for demersal cod on the shelf. Years with high cod production seem to be associated with a high abundance of sandeels. In deeper areas on the plateau other species (mainly Norway pout) are more important as prey item for cod. On the slope other species (mainly blue whiting) may be important. 4 ICES Advice 2008, Book 4 Sandeel recruitment and abundance has been low since the productive years 1999–2001, and is still at a low level. This seems to have affected the growth rates and abundance of cod, and apparently of haddock too. Despite a marked increase in fishing effort on cod and haddock, the landings have not increased correspondingly. The long-term landings of the cod usually have fluctuated between 20 000 and 40 000 tonnes during the 20th century and of haddock between 12 000 and 25 000 tonnes since the 1950s. The catches of these two main fish stocks have therefore for a long time reached the limit for long-term production within the ecosystem. Variability between years in catches of these species reflects variability in production of the fish stocks. During the early 1990s the catches of cod and haddock decreased to the lowest on record. The decrease coincided with a severe decrease in productivity in the ecosystem in general, covering all trophic levels, from primary production to fish and seabird feeding conditions, reproduction, and growth rates. The ecosystem productivity increased markedly during the first half of 1990s, and the cod and haddock stocks recovered rapidly, due to increased recruitment success, individual growth rates, and due to low fishing mortality during that period (Gaard et al., 2002; Steingrund et al., 2003; ICES, 2007; Steingrund and Gaard, 2005). Due to low cod recruitment on the Faroe shelf in recent years the stock has decreased to the same low level as in the early 1990s. The haddock stock is close to average but is decreasing. Since the monitoring of environmental parameters started in 1990 a clear relationship has been observed, from primary production to the higher trophic levels, which seem to respond quickly to variability in the primary production in the ecosystem. Fish migration versus age and feeding conditions After the pelagic phase juvenile cod and saithe migrate into shallow areas while the haddock juveniles are dispersing all over the shelf area. At an age of about 2 years cod gradually migrate into deeper habitats on the shelf. Saithe migrates into deeper waters on the upper shelf slope at an age of about 3 years (Figure 4.1.6). A high variability in distribution between years is observed, however, for cod. During years with poor feeding conditions adult cod tend to migrate into shallow areas. This seems to affect cod recruitment negatively. Inside 130 m isobath (%) Tagging experiments have shown that migration between Faroe Plateau and neighbouring areas is negligible (Joensen et al., 2005). 80 60 40 20 0 1 2 3 4 5 6 7 Age Cod Figure 4.1.6 Haddock Saithe Proportion of cod, haddock and saithe caught inside the 130 m isobath during summer groundfish surveys 1996–2003. (From Steingrund and Gaard, 2005). Cod and haddock recruitment Data series for cod since 1961 and since 1970 for haddock show no direct relationship between SSB and recruitment fluctuations on the Faroe plateau. On the other hand, long-term relations between cod and haddock recruitment and weight-at-age have demonstrated that periods with high weight-at-age occur simultaneously with good recruitment of 2year-old fish and vice versa (Figure 4.1.7) (Gaard et al., 2002; 2006). This underlines strong simultaneous environmental affects on cod and haddock recruitment and growth rates. ICES Advice 2008, Book 4 5 Environmental conditions on the Faroe plateau are highly variable and their strong effects on cod and haddock recruitment clearly overshadow spawning stock effects. The cod and haddock stocks have proven that when environmental conditions are favourable, they are, even with very small SSB, able to recover quickly. It is, however, when the environmental conditions are poor, that the spawning stock influence on recruitment success most likely is highest. Therefore the importance of spawning stocks should not be underestimated – although it is no guarantee for recruitment success. The recommended B lim for cod and haddock should therefore be more conservative than the observed successful SSBs in the most productive years. 50 3.4 40 3.0 30 Recruitment (mill.) 2,6 20 10 2.2 0 150 1.8 1.5 Haddock 100 1.25 50 0 1970 1.0 1980 Recruitment Figure 4.1.7 1990 2000 Mean weight at age 2-6 (kg) Cod 0.75 2010 Weight at age 2-6 Relationship between recruitment of 2 years old cod and haddock and the mean weight of 2–6 years old cod during 1970–2006 and haddock during 1977–2006 on the Faroe shelf. Since 1990, when monitoring of environmental parameters in the Faroe shelf ecosystem started, clear co-occurring fluctuations can be observed in primary production and recruitment of cod and haddock. However, the abundance of older cod in shallow areas also affects cod recruitment negatively. During periods with low food abundance (low primary production) adult cod (mainly those with low condition factor) tend to migrate into shallow areas, and this affects cod recruitment negatively. When comparing cod recruitment with a combined positive effect from primary production and a negative effect from abundance of adult cod in shallow areas, a very good correlation (R 2 ~ 0.8) is obtained (Steingrund, unpubl. data). The year-class strength of Faroe Plateau cod seems to be determined rather late in life: Recruitment estimates of 2-yearold cod co-fluctuates positively with primary production the year before. These fluctuations indicate that year-class strength is mainly determined when the cod is 1 year old. (Steingrund and Gaard, 2005; Steingrund, unpublished data). The very good relationship between primary production combined with abundance of adult cod in shallow areas and cod recruitment allows prediction of cod stock recruitment earlier than traditional stock assessment methods. Cod and haddock growth rates Growth rates on cod and haddock on the Faroe plateau are highly variable. Since 1990 the mean growth rates of 2–8 years old cod have fluctuated between 0.3 and 1.6 kg individual -1 year-1 and the mean growth rates of 2–8 years haddock between 0.1 and 0.5 kg individual-1 year-1. No correlation is between the growth rates and the in situ temperature, but good relationship is found between primary production and growth variability of both species (Figure 4.1.8). The growth rates are mainly affected by the highly variable food production. The causal mechanism seems to be a positive relationship between phytoplankton production, zooplankton production and production of food organisms for cod and haddock (e.g., benthic crustaceans, polychaets, and especially sandeels and Norway pout). 6 ICES Advice 2008, Book 4 Since primary production is rapidly transferred to cod and haddock, they obviously eat young prey items, at least during periods with high growth rates. Detailed analysis of interannual variability in food items for cod and haddock are not available at the present, but the available information indicates that sandeel is a main food item during productive years. In low-productive years they seem to predate more on benthic fauna. Fish furthermore seems to be a more prevalent prey item for cod than for haddock. This may be a reason for why haddock growth variability often is lagging one year behind cod growth variability, especially during low productive periods (Figure 4.1.8). 15 1,6 12 1,2 9 0,8 6 0,4 3 0 0 18 1990 Primary prod uction 15 1995 Haddock 2000 Primary production 2005 0,6 Growth 12 0,4 9 6 0,2 3 0 0 1990 1995 Primary production Figure 4.1.8 Cod growth rates (kg year-1) 2 Cod 2000 Haddock gro wth rates (kg year-1) Primary prod uction index 18 2005 Growth, 2-8 years Index of new primary production and mean growth rates since the year before, for cod (upper panel) and haddock (lower panel) since 1990. As pointed out in Section 4.1.1.5 sandeel recruitment and abundance has been at a low level since the productive years 1999–2001. This has affected feeding conditions for especially cod and most likely haddock too. Weight-at-age for cod and haddock are at present at a very low level (Figure 4.1.7). During the last two years it has stabilized for cod but decreased for haddock in 2006. Consequently, the average growth rate of cod has been slightly higher than expected from the primary production index alone, possible due to the very low cod abundance. Fish production Fish production in the ecosystem is clearly food limited. Mainly cod production (numbers × individual growth summed up for all age groups) fluctuates relatively well with primary production (Figure 4.1.9). When comparing primary production with production of cod haddock and saithe combined, the correlation is even better. ICES Advice 2008, Book 4 7 18 80 Cod. R2 = 0.43 250 Cod + haddock + saithe. R2 = 0.65 14 60 12 10 40 8 6 20 4 Cod production (thous. t) Primary prooduction index Primary production index 16 2 0 1990 1992 1994 1996 1998 2000 2002 2004 2006 Index of prim. prod. Figure 4.1.9 0 15 200 12 150 9 100 6 50 3 0 1990 1992 1994 1996 1998 2000 2002 2004 2006 Fish prod. (1000 t) Index of prim.prod. Cod + haddock + saithe prod. (1000 t) 18 0 Fish prod. (1000 t) Index of new primary production on the Faroe shelf and corresponding production one year ahead, of cod (left panel) and cod + haddock + saithe (right panel). Since young age groups are the most numerous (mainly in the productive years) the observed variability in cod production in Figure 4.1.9 largely is due to variable abundances of recruits (Figure 4.1.10). The production variability is, thus, affected by variable recruitment (uncertain for the last year) and fishing effort. By combining Figures 4.1.8, 4.1.9, and 4.1.10, the low cod production during the last years seems to be due to low cod abundance and not low growth rates. The figure furthermore illustrates, that in the 1960s and 1970s the proportion of production of older age classes was clearly higher than in recent times. The reason most likely is higher fishing mortalities in the later years. As cod grow older, they tend to move into deeper areas (Figure 4.1.6), a part of them feeding on the slope outside the shelf front. This may increase production capacity of the cod stocks. However, information is not available at the moment to quantify this potential effect. Cod production (tonnes) 80000 8-9 7-8 60000 6-7 5-6 40000 4-5 3-4 20000 2-3 1-2 Figure 4.1.10 2003 2000 1997 1994 1991 1988 1985 1982 1979 1976 1973 1970 1967 1964 1961 0 Production of Faroe Plateau cod, split into age groups. Benthos Due to strong tidal currents, the seabed in shallow regions on the shelf (except sheltered fjords) consists mainly of sand on stones. In deeper areas is mort silt and organic material. The benthic fauna on the shelf is diverse with e.g. polychaetes, decapods, echinoderms, and bivalves as important groups. On the slope coral and sponge areas occur. The coral areas have been reduced due to trawling and therefore the authorities in 2004 have closed three areas for trawling. On the shelf there is local fishery (dredging) for scallops and in inshore areas there is trap fishery for Norway lobster (Nephrops). 8 ICES Advice 2008, Book 4 Ecosystem effects of the fisheries Trawling activity has caused a significantly reduce the distribution areas of corals (Lophelia pertusa) on the shelf and bank slopes. Therefore the Faroese authorities in 2004 have closed three coral areas for trawling. Since fishery on the Faroe Plateau is effort regulated, discard of commercially fish most likely is small. The level of bycatch of non-commercial species and of non-commercial size in unknown and may be higher, especially during periods of high recruitment. In addition to effort regulation (limited number of fishing days), spawning grounds are closed for fishing activity, and large areas on the shelf are permanently or periodically closed for trawling. Furthermore, trawling is regulated by mesh sized. The current management regime which limits effort and spatial access for certain gear is likely to be effective for demersal fish stocks (Zeller and Reinert, 2004). Concluding remarks The Faroe Islands utilize an effort- and spatial-based system of fisheries management. Successful management of such a system is dependent on information on influences from environmental variables on the fish stocks, individual behaviour, and catchability. Environmental effects in the Faroe shelf ecosystem are strong may be useful in prediction of cod and haddock recruitment and growth rates as well as in management regulations. The highly variable environmental conditions on the Faroe plateau have very strong influences on cod and haddock recruitment. Recruitment of 2-year-old cod correlates positively with primary production and negatively with abundance of adult cod in shallow areas the year before. In years with low food abundance cod tend to migrate into shallow areas, affecting cod recruitment negatively. A high correlation is observed between recruitment of 2-year-old cod and environmental conditions for cod (primary production combined with abundance of adult cod in shallow areas) one year before, indicating that recruitment mainly is determined as 1-year-old cod. Growth rates of cod and haddock are also highly affected by feeding conditions. Relationship between environmental conditions for cod and haddock (food abundance) and longline catchability may also be useful information from a management perspective. In and effort management regime with a limited number of fishing days, expected catchability changes may need to be incorporated in the advice on fisheries. For cod there is observed a link between primary production and individual growth rates (Figure 4.1.8). The cod growth rates seem to be negatively correlated with the catchability of longlines, suggesting that cod prefer longline baits when natural food abundance is low. Since longliners usually take a large proportion of cod catch, the total fishing mortality fluctuates in the same was as the longline catchability and there is thus a negative relationship between cod growth and mortality. For haddock there seems a similar mechanism as for cod. Although the catchability for longliners (which take the majority of the catch) as estimated for the longliners logbooks does not follow the expected pattern for the first time of the series (1986–1995), it may be a result of very small catches in that period when the stock biomass was low. The fact that a negative relationship is observed between growth rates and fishing mortality suggests that the same mechanism is valid for haddock as for cod. It is, however, important to note that the relationship between productivity of the ecosystem and the catchability of longlines depends on age of the fish. The relationship is most clear for fish age 5. For cod age 3 and 4 the relationship is less clear, and for young haddock there apparently is no such relationship between productivity and catchability. For saithe no clear relationship is observed between catchability for pair trawlers (which take the majority of the catches) and other variables such as primary production, growth, and stock size. The catchability analysis reported above suggests that natural factors may have a large influence on longline catchability for cod and haddock. In 2006 the primary production was slightly below average. Considerations for assessments and advice The primary production in 2007 was below the 1990–2007 average and was close to the 2005 level and no major changes are therefore expected in cod and haddock feeding conditions from 2006 to 2007. The following environmental information should considered implemented in assessment and management advice of the Faroe plateau cod stock and the Faroe haddock stock: ICES Advice 2008, Book 4 9 In effort regulation variable longline catchability for cod and haddock seems to be affected by variable feeding conditions. Variability in catchability is therefore important in management advice. Expected environmental effects on longline catchability for cod and haddock were included in the assessment and the advice for 2007. However, estimated variability in cod and haddock catchability, based on environmental information, and growth rates of cod and haddock, should be considered implemented even further quantitatively, in future assessment work. The co-fluctuation between plankton productivity and cod and haddock recruitment and growth rates (weightat-age) since 1990 should be considered used for improved predictions for recruitment and weight for cod and haddock. References: Debes, H. H., Hansen, B. W., and Hansen, P. J. 2005. The relative importance of protozooplankton and copepods as grazers on phytoplankton during the 1999 spring bloom on the Faroe shelf. Fróðskaparrit, 53: 82–99. Debes, H. H., and Eliasen, S. K. 2006. Seasonal abundance, reproduction and development of four copepod species on the Faroe shelf. Mar. Biol. Res., 2: 249–259. Debes, H. H., Gaard, E., and Hansen, B. 2008a. Primary production on the Faroe Shelf: Temporal variability and environmental influences. (Submitted for publication). Debes, H. H., Eliasen, S. K., and Gaard, E. 2008b. Seasonal variability in copepod ingestion and egg production on the Faroe shelf. (Hydrobiologia, in press). Eliasen, S. K., Gaard, E., Hansen, B., and Larsen, K. M. H. 2005. A “horizontal Sverdrup mechanism” may control the spring bloom around small oceanic islands and over banks. Journal of Marine Systems, 56: 352–362. Gaard, E. 1999. Zooplankton community structure in relation to its biological and physical environment on the Faroe Shelf, 199–1997. J. Plankton Res. 21: 1133–1152. Gaard, E. 2003. Plankton variability on the Faroe shelf during the 1990s. ICES Marine Science Symposia, 219: 182– 189. Gaard, E., Hansen, B., and Heinesen, S. P. 1998. Phytoplankton variability on the Faroe Self. ICES J. Mar. Sci., 55: 688–696. Gaard, E., and Steingrund, P. 2001. Reproduction of the Faroe Plateau cod: Spawning ground, egg advection and larval feeding. Fróðskaparrit, 48: 87–103. Gaard, E., and Reinert, J. 2002. Pelagic cod and haddock on the Faroe Plateau: Distribution, diets and feeding habitats. Sarsia, Vol. 87: 193–206. Gaard. E., Hansen, B., Olsen, B., and Reinert, J. 2002. Ecological features and recent trends in physical environment, plankton, fish stocks and sea birds in the Faroe plateau ecosystem. In: K. Sherman and H-R Skjoldal (eds). Large Marine Ecosystems of the North Atlantic. Changing States and Sustainability. 245–265. Elsevier. 449 pp. Gaard, E., Gislason, Á., and Melle, W. 2006. Iceland, Faroe and Norwegian coasts. In: A. Robinson and K. Brink (Eds.). The Sea, vol. 14. pp 1073–1115. Hansen, B., and Østerhus, S. 2000. North Atlantic-Nordic Seas exchanges. Progress in Oceanography, 45: 109–208. Hansen, B., Eliasen, S. K., Gaard, E., and Larsen, K. M. H. 2005. Climatic effects on plankton and productivity on the Faroe Shelf. ICES J. Mar. Sci., 62: 1224–1232. Holliday, N. P., Hughes, S. L., Bacon, S., Beszczynska-Möller, A., Hansen, B., Lavin, A., Loeng, H., Mork, K. A., Østerhus, S., Sherwin, T., and Walczowski, W. 2008. Reversal of the 1960s and 1990s freshening trend in the northeast North Atlantic and Nordic Seas. Geophysical Research Letters, vol. 35, L03614, doi:10.1029/2007GL032675, 2008. pp. 1–5. ICES. 2006. Report of the North-Western Working Group (NWWG). Demersal Stocks in the Faroe Area (Division Vb and Subdivision IIA4). ICES CM 2006/ACFM:26. Joensen, J. S., Steingrund, P., Henriksen, A., and Mouritsen, R. 2005. Tagging experiments at the Faroes 1952-1965. Fróðskaparrit, 53: 100–135. Kristiansen, R. 2007. Feeding ecology of pelagic juvenile cod (Gadus morhua) on the Faroe Plateau, 2000–2005. M. Sc. Thesis, Inst. of Biol. Science, University of Århus. 57 pp. Nielsen, K. K. 2007. Feeding ecology of larval cod (Gadus morhua L.) on the Faroe Shelf, 1998–2005. M. Sc. Thesis, Inst of Biol. Science, University of Århus. 96 pp. Steingrund, P., Ofstad, L. H., and Olsen, D. H. 2003. Effect of recruitment, individual weights, fishing effort, and fluctuating longline catchability on the catch of Faroe Plateau cod (Gadus morhua, L.) in the period 1989–1999. ICES Marine Science Symposia, 219: 418-420. Steingrund, P., and Gaard, E., 2005. Relationship between phytoplankton production and cod production on the Faroe shelf. ICES J. Mar. Sci. 62: 163–176. Zeller, D., and Reinert, J. 2004. Modelling spatial closures and fishing effort restrictions in the Faroe Islands marine ecosystem. Ecological modelling, 172: 403–420. 10 ICES Advice 2008, Book 4
