Assignment Chapter 2, Process Management
advertisement
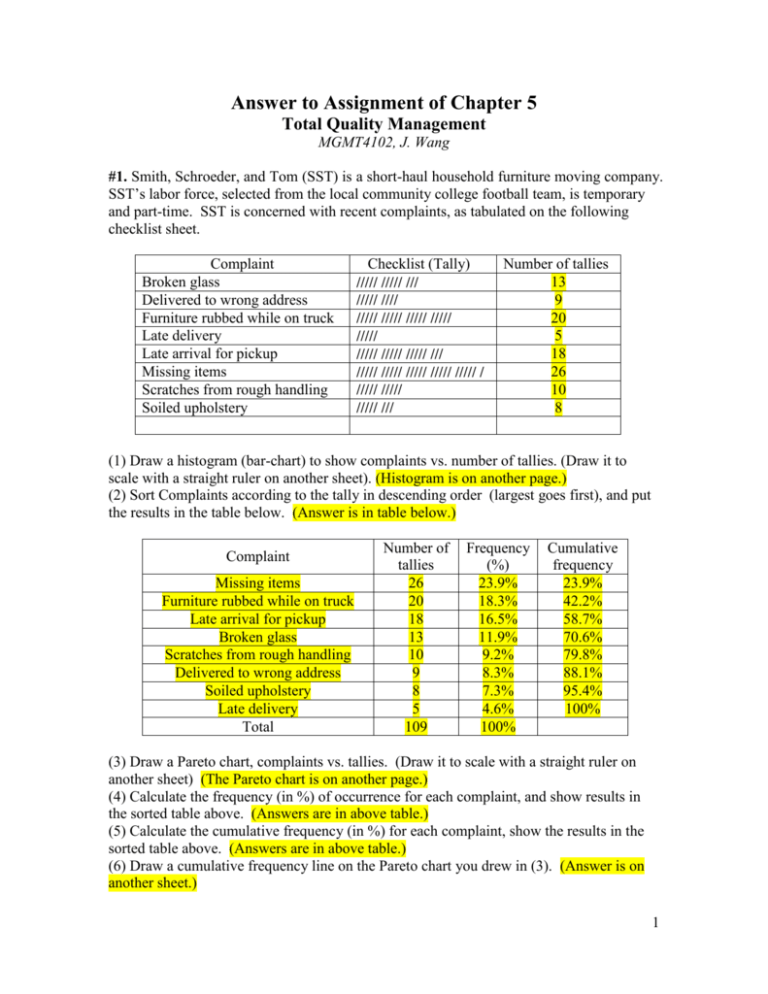
Answer to Assignment of Chapter 5 Total Quality Management MGMT4102, J. Wang #1. Smith, Schroeder, and Tom (SST) is a short-haul household furniture moving company. SST’s labor force, selected from the local community college football team, is temporary and part-time. SST is concerned with recent complaints, as tabulated on the following checklist sheet. Complaint Broken glass Delivered to wrong address Furniture rubbed while on truck Late delivery Late arrival for pickup Missing items Scratches from rough handling Soiled upholstery Checklist (Tally) ///// ///// /// ///// //// ///// ///// ///// ///// ///// ///// ///// ///// /// ///// ///// ///// ///// ///// / ///// ///// ///// /// Number of tallies 13 9 20 5 18 26 10 8 (1) Draw a histogram (bar-chart) to show complaints vs. number of tallies. (Draw it to scale with a straight ruler on another sheet). (Histogram is on another page.) (2) Sort Complaints according to the tally in descending order (largest goes first), and put the results in the table below. (Answer is in table below.) Complaint Missing items Furniture rubbed while on truck Late arrival for pickup Broken glass Scratches from rough handling Delivered to wrong address Soiled upholstery Late delivery Total Number of tallies 26 20 18 13 10 9 8 5 109 Frequency (%) 23.9% 18.3% 16.5% 11.9% 9.2% 8.3% 7.3% 4.6% 100% Cumulative frequency 23.9% 42.2% 58.7% 70.6% 79.8% 88.1% 95.4% 100% (3) Draw a Pareto chart, complaints vs. tallies. (Draw it to scale with a straight ruler on another sheet) (The Pareto chart is on another page.) (4) Calculate the frequency (in %) of occurrence for each complaint, and show results in the sorted table above. (Answers are in above table.) (5) Calculate the cumulative frequency (in %) for each complaint, show the results in the sorted table above. (Answers are in above table.) (6) Draw a cumulative frequency line on the Pareto chart you drew in (3). (Answer is on another sheet.) 1 (7) If the first two most frequent complaints got resolved, how many percents of the complaint problem would be resolved? 42.2%. What if the first three most frequent complaints got resolved? 58.7%. #2. (1) P(the car works without a fatal problem) = 0.998786 = 0.8942 = 89.42% (2) P(the car won’t work due to at least one fatal problem) = 10.8942 = 0.1058 = 10.58% (3) The car is not reliable at all. The chance to have a ‘fatal’ problem is 10.58%, which means that for 100 times you use this car, there would be 10 times you have big trouble; or on average for every 10 times you drive your car, you would have a ‘fatal’ problem. This reliability is not acceptable. #3. (1) Reliability of this plane is: (1–0.00005)817 = 0.99995817 = 0.95997 = 96%. (2) This airplane is too dangerous. The reliability of 96% means that on average for 100 times boarding on this plane there would be four times with ‘fatal’ problems, or for 25 times boarding on this plane there would be once with a ‘fatal’ problem, or for 10,000 times of the plane’s taking off there would be 400 times with fatal problems (Every day, there are more than 10,000 planes taking off). p. 192. Problems #5. Rsystem = R1*R2*R3 = 0.9*0.89*0.95 = 0.76095 = 76.095% Problem #6. The reliabilities of the parts with backups: Rpart1 with backup = R1+(1–R1)Rpart1’s backup = 0.9+(1–0.9)0.8 = 0.98. Rpart2 with backup = R2+(1–R2)Rpart2’s backup = 0.89+(1–0.89)0.8 = 0.978. Rpart3 with backup = R3+(1–R3)Rpart3’s backup = 0.95+(1–0.95)0.8 = 0.99. Rsystem = (Rpart1 with backup)( Rpart2 with backup)( Rpart3 with backup) = 0.98*0.978*0.99 = 0.94858 = 94.858%. Problem #7. Rsystem = 0.9+(1–0.9)0.8 = 0.98. Problem #9. Probability(developing the vaccine successfully) = Probability(at least one team succeeds) = 1- Probability(all three teams fail) = 1 – [(1–0.9)*(1–0.85)*(1–0.7)] = 1 – [0.1*0.15*0.3] = 1 – 0.0045 = 0.9955. 2 Alternatively, we may take the three team system as one with backups. That is, if Team 1 fails, then Team 2 kicks on; if Team 2 fails either, Team 3 kicks on. Let Reliability of system, Rsystem=Probability(developing the vaccine successfully). Let Ri = Probability(Team i succeeds), i=1,2,3. Rsystem = R1 + Prob(Team 1 fails)*R2 + Prob(Team 1 and 2 both fail)*R3 = 0.9 + (1–0.9)*0.85 + (1–0.9)(1–0.85)*0.7 = 0.9 + 0.085 + 0.0105 = 0.9955. The probability that BioTech will develop the vaccine successfully is 0.9955. Problem #10. R2nd part with backup = 0.85 + (1–0.85)*0.85 = 0.9775. R3rd part with backup = 0.9 + (1–0.9)*0.9 = 0.99. Rsystem = R1st part * R2nd part with backup * R3rd part with backup * R4th part = 0.9 * 0.9775 * 0.99 * 0.95 = 0.8274. 3 Problem #1, Histogram chart Problem #1, Pareto chart 4 Problem #1. Cumulative frequency curve 5
