Introduction to Probability and Statistics
advertisement
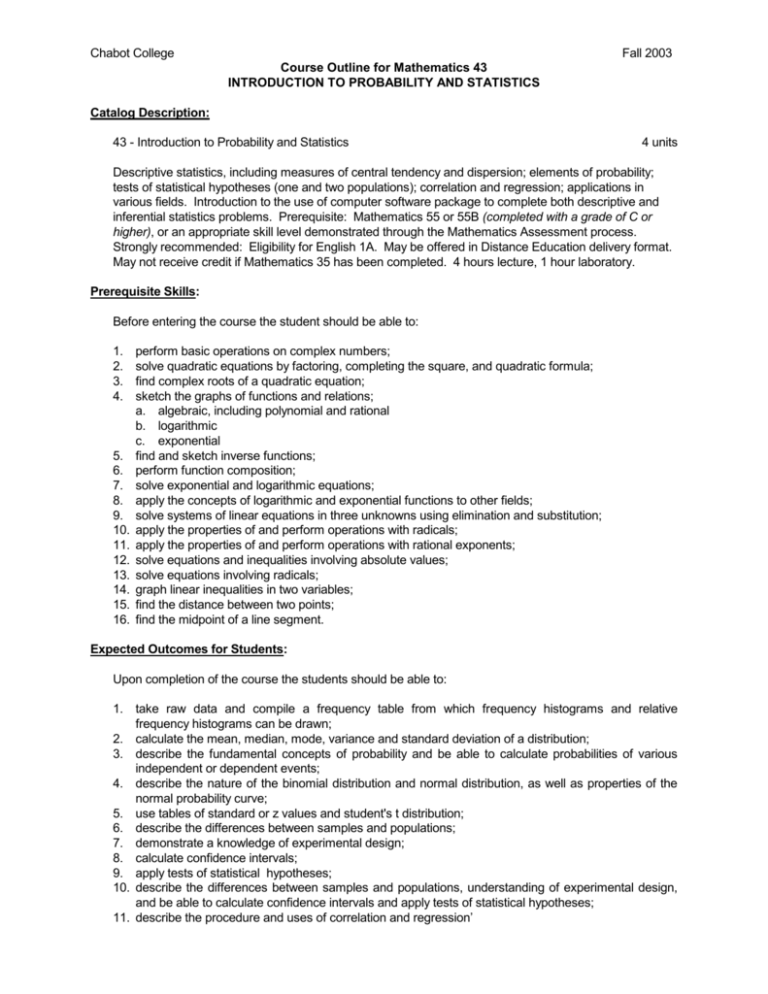
Chabot College Fall 2003 Course Outline for Mathematics 43 INTRODUCTION TO PROBABILITY AND STATISTICS Catalog Description: 43 - Introduction to Probability and Statistics 4 units Descriptive statistics, including measures of central tendency and dispersion; elements of probability; tests of statistical hypotheses (one and two populations); correlation and regression; applications in various fields. Introduction to the use of computer software package to complete both descriptive and inferential statistics problems. Prerequisite: Mathematics 55 or 55B (completed with a grade of C or higher), or an appropriate skill level demonstrated through the Mathematics Assessment process. Strongly recommended: Eligibility for English 1A. May be offered in Distance Education delivery format. May not receive credit if Mathematics 35 has been completed. 4 hours lecture, 1 hour laboratory. Prerequisite Skills: Before entering the course the student should be able to: 1. 2. 3. 4. 5. 6. 7. 8. 9. 10. 11. 12. 13. 14. 15. 16. perform basic operations on complex numbers; solve quadratic equations by factoring, completing the square, and quadratic formula; find complex roots of a quadratic equation; sketch the graphs of functions and relations; a. algebraic, including polynomial and rational b. logarithmic c. exponential find and sketch inverse functions; perform function composition; solve exponential and logarithmic equations; apply the concepts of logarithmic and exponential functions to other fields; solve systems of linear equations in three unknowns using elimination and substitution; apply the properties of and perform operations with radicals; apply the properties of and perform operations with rational exponents; solve equations and inequalities involving absolute values; solve equations involving radicals; graph linear inequalities in two variables; find the distance between two points; find the midpoint of a line segment. Expected Outcomes for Students: Upon completion of the course the students should be able to: 1. take raw data and compile a frequency table from which frequency histograms and relative frequency histograms can be drawn; 2. calculate the mean, median, mode, variance and standard deviation of a distribution; 3. describe the fundamental concepts of probability and be able to calculate probabilities of various independent or dependent events; 4. describe the nature of the binomial distribution and normal distribution, as well as properties of the normal probability curve; 5. use tables of standard or z values and student's t distribution; 6. describe the differences between samples and populations; 7. demonstrate a knowledge of experimental design; 8. calculate confidence intervals; 9. apply tests of statistical hypotheses; 10. describe the differences between samples and populations, understanding of experimental design, and be able to calculate confidence intervals and apply tests of statistical hypotheses; 11. describe the procedure and uses of correlation and regression’ Chabot College Course Outline for Mathematics 43, Page 2 Fall 2003 12. discuss the nature of the Chi-square distribution and its use for goodness of fit and independence test; 13. demonstrate a knowledge of the use of computer software packages as they pertain to histograms, regression analysis, confidence interval constructions, and hypothesis tests. Course Content: 1. Mathematical fundamentals, including summation notation 2. Analysis of data a. Frequency distributions b. Frequency histograms c. Measures of central tendency 1) Mean 2) Median 3) Mode d. Measures of dispersion 1) Range 2) Variance 3) Standard Deviation e. Percentiles f. Empirical rule g. Types of data 3. Introduction to correlation and regression 4. Probability a. Introduction b. Probability laws 5. Probability distributions a. Uniform b. Binomial c. Normal d. Chi-square 6. Sampling distributions 7. Estimation and hypothesis testing for one and two populations a. Basic concepts b. Experimental design c. Applications to the normal distribution d. Introduction to student's t test 8. Chi-square procedures a. Goodness-of-fit test b. Independence test Methods of Presentation: 1. 2. 3. 4. 5. Lecture Problem solving Student participation Classroom discussion Videos Assignments and Methods of Evaluating Student Progress: 1. Typical Assignments a. Exercises from the textbook Determine the range and sample standard deviation of the tornado occurrence data in Exercise 3.43. Discuss one major drawback to the standard deviation as a measure of Chabot College Course Outline for Mathematics 43, Page 3 Fall 2003 variation. b. Computer assignments using Minitab Enter the data on test scores into a Minitab worksheet. Create a histogram, stem-and-leaf diagram, and boxplot of the data. Calculate the mean, standard deviation, and five-number summary. Write a brief analysis of the data based on these graphical and numerical summaries. 2. Methods of Evaluation Student Progress a. Quizzes and homework b. Midterm(s) c. Final examination Textbook(s) (Typical): Introduction to Statistics, Weiss and Hassett, Addison Wesley Publishers,1999. Special Student Materials: Scientific calculator 989Curriculum/math/43/9810.09 hps css Math43.091500.rev1 Revised: 09/15/00 CSS: 09-10-01 AW: 09-25-01 MATH 43 Outline Fall 2002 Revised Anita Wah Sept 2002
