Variations in community structure along environmental and
advertisement

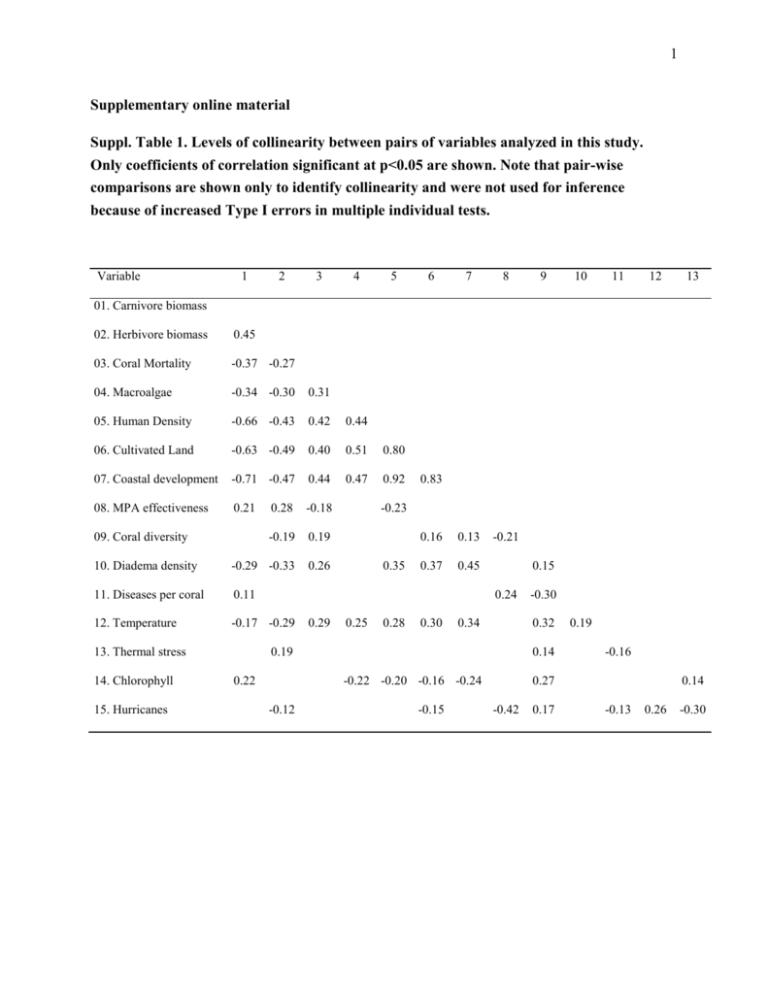
1 Supplementary online material Suppl. Table 1. Levels of collinearity between pairs of variables analyzed in this study. Only coefficients of correlation significant at p<0.05 are shown. Note that pair-wise comparisons are shown only to identify collinearity and were not used for inference because of increased Type I errors in multiple individual tests. Variable 1 2 3 4 5 6 7 8 0.16 0.13 -0.21 0.37 0.45 9 10 11 12 13 01. Carnivore biomass 02. Herbivore biomass 0.45 03. Coral Mortality -0.37 -0.27 04. Macroalgae -0.34 -0.30 0.31 05. Human Density -0.66 -0.43 0.42 0.44 06. Cultivated Land -0.63 -0.49 0.40 0.51 0.80 07. Coastal development -0.71 -0.47 0.44 0.47 0.92 08. MPA effectiveness 0.21 0.28 -0.18 -0.19 0.19 10. Diadema density -0.29 -0.33 0.26 11. Diseases per coral 0.11 12. Temperature -0.17 -0.29 09. Coral diversity 13. Thermal stress 14. Chlorophyll 15. Hurricanes 0.83 -0.23 0.35 0.15 0.24 0.29 0.25 0.28 0.30 0.34 0.32 0.19 0.22 0.14 -0.22 -0.20 -0.16 -0.24 -0.12 -0.30 -0.15 0.19 -0.16 0.27 -0.42 0.17 0.14 -0.13 0.26 -0.30 2 Methods. Databases. Fish Biomass. Fish biomass was quantified based on the visual count of fishes and estimation of their body length along transects haphazardly located in each of the reef sites. Transects were initially 50 x 2 m but were later reduced to 30 x 2 m to optimize the sampling. To control for this change, all data were standardized to the same metric unit. The number of transects varied from 3 to 10 per site with a total of 3022 fish transects analyzed. To reduce inter-observer biases in the identification of species and failure to spot cryptic species, censuses targeted 67 conspicuous and easily identifiable fish species. These species belong to all trophic levels, encompass nearly all body sizes and account for most of the biomass in the coral reefs of the Caribbean. Measurements of body length were converted to biomass by using the allometric length-weight conversion: W=aBLb, where W is weight in grams, BL is body length in cm and parameters a and b are constants available in Fishbase (www.fishbase.org). All species were classified as carnivores or herbivores depending on whether their trophic level, as provided by Fishbase, was above 3 or below 2, respectively. Coral mortality, macroalgae abundance, diseases and coral diversity. The abundance of corals was quantified as the number of stony corals along 10 x 1 m transects haphazardly located in each of the sites (n= 2952 coral transects). Because most of analyzed stressors were based on rather contemporary measurements (see below), coral mortality was calculated as the fraction of coral colonies in a transect with 100% of their outward-facing surface recently dead. Macroalgae abundance was calculated as the percent coverage of macroalgae multiplied by their height in centimeters. Coral diseases was calculated as the fraction of corals per transect showing the following diseases: black band, white band, white spots, white plague, yellow blotch and red band. Coral diversity was calculated as the number of coral species per transect. Extended details of the sampling methodology can be found at www.agrra.org. Human density. This variable quantified the maximum number of people that occurred within a 50 km radius of each site. Estimates of human population density for the year 2000 were obtained from the Gridded Population of the World V.3 as available at the Socioeconomic Data and Applications Center (http://sedac.ciesin.org/gpw/). This database depicts the distribution of the human population across the globe at a 0.25 degree resolution. Cultivated land. This variable quantified the area of cultivated land that occurred within a 50 km radius of each site. Data on cultivated land was obtained from the Global Land Cover 2000 database (http://www-gvm.jrc.it/glc2000/). This database depicts the spatial distribution of 21 different land attributes for the years 1999-2000 as calculated from satellite images at 1 km resolution. Coastal development. This variable quantified the number of roads and use of electrical power within a 50 km radius of each site. The variables were scaled from 0 to 1 and multiplied to produce an index of development. The use of electrical power was measured as the area illuminated by human lights as quantified by satellite images taken at night (see ref. Sanderson et al. 2002 for rationale). All data were obtained from Hearn et al. (2003). 3 Marine protected area effectiveness. MPAs are highly variable in their objectives and enforcement of regulations, which can lead to variations in their actual effect. To incorporate these factors in our analysis, we calculated an index of effectiveness for reef sites located in MPAs. This index is a weighted average of the scores received by MPAs in different attributes. These attributes included regulations about the extraction of resources (i.e. we use different classifications depending on how MPAs combined no-take areas with regulations on artisanal, recreational and commercial fishing), enforcement and compliance (i.e. whether poaching was none, low, medium or high), risk from external threats (i.e. whether external risks were low, medium or high, see details in Burke & Maidens 2004) and the size and year of creation of the MPA. This calculation does not include socioeconomic data, which may affect the effectiveness of MPAs. Fortunately, socioeconomic variables are likely to be reflected by the level of enforcement and compliance with regulations, which in combination determine levels of poaching, which we did quantify. More details and data in Mora et al (2006) and Reefbase. Temperature. This variable quantified the average temperature at each site. Data on sea surface temperature (SST) was obtained from daily records between 1985 to 2000 as quantified by the Pathfinder Advanced Very High Resolution Radiometer (AVHRR). These data have a 0.25 degree resolution and use consistent SST algorithms, improved satellite and inter-satellite calibration, quality control and cloud detection. Based on these data we also calculated the frequency of pentads (i.e. five days periods) in which temperature was 1oC above typical summer temperature (http://www.nodc.noaa.gov/sog/wwf/). Hurricanes. This variable quantified the number of category 2-5 hurricanes whose main trajectories were within a 50 km radius of each site. Data on hurricane trajectories were obtained from UNISYS Atlantic Tropical Storm Tracking (http://weather.unisys.com/hurricane/atlantic/index.html). Frequencies were calculated on the hurricanes that occurred between 1960 and 2000. Chlorophyll. This variable quantified the chlorophyll anomalies at each site as the deviation from the long-term chlorophyll average. Data were obtained from high resolution chlorophyll products as provided by SeaWIFS (http://oceancolor.gsfc.nasa.gov/). References Burke, L. & Maidens, J. 2004. Reefs at risk in the Caribbean (World Resources Institute, Washington, US). Hearn, P. et al. 2003. Global GIS: A Digital Atlas of Planet Earth (American Geological Institute, Alexandria, VA, USA. Mora, C., Andréfouët, S., Costello, M., Kranenburg, S., Rollo, A., Veron, J., Gaston, K.J. & Myers, R.A. 2006. Coral reefs and the global network of Marine Protected Areas. Science, 312, 1750-1751. Sanderson, E.W., Jaiteh, M., Levy, M.A., Redford, K., Wannebo, A. & Woolmer, G. 2002. The human footprint and the last of the wild. Bioscience, 52, 891-904. 4 Figure S1. Spatial representation of the variables analyzed in this study. 5 Figure S1 cont. Luminosity (Electrical power) 6 Figure S1 cont.


