Table S4. - BioMed Central
advertisement
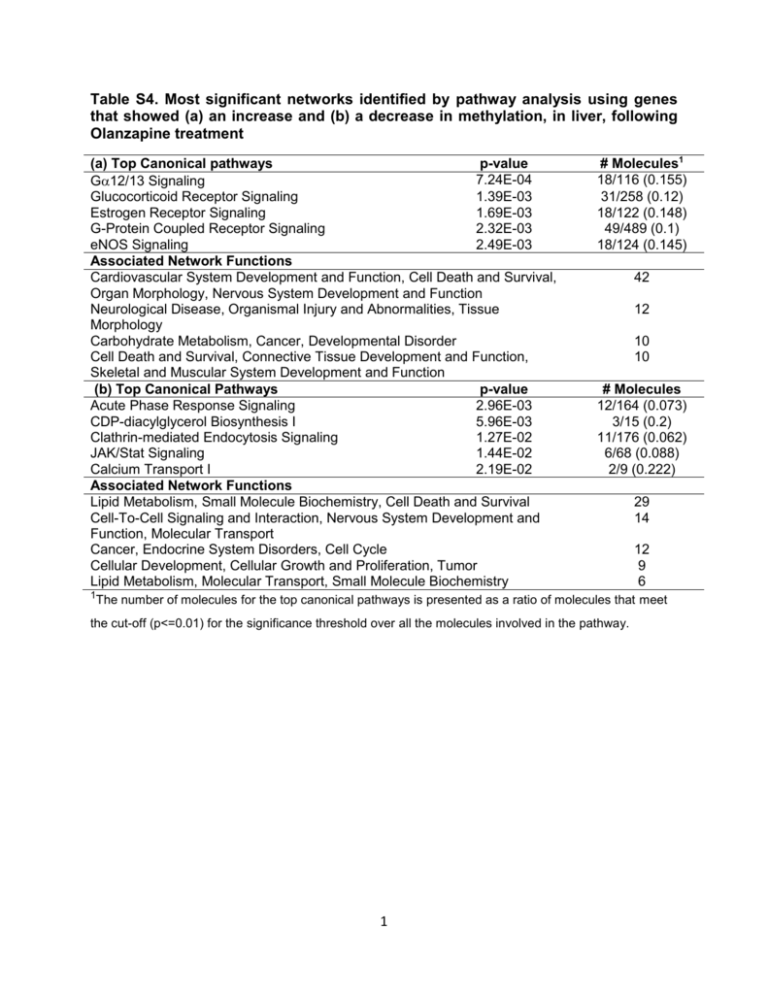
Table S4. Most significant networks identified by pathway analysis using genes that showed (a) an increase and (b) a decrease in methylation, in liver, following Olanzapine treatment (a) Top Canonical pathways p-value 7.24E-04 G12/13 Signaling Glucocorticoid Receptor Signaling 1.39E-03 Estrogen Receptor Signaling 1.69E-03 G-Protein Coupled Receptor Signaling 2.32E-03 eNOS Signaling 2.49E-03 Associated Network Functions Cardiovascular System Development and Function, Cell Death and Survival, Organ Morphology, Nervous System Development and Function Neurological Disease, Organismal Injury and Abnormalities, Tissue Morphology Carbohydrate Metabolism, Cancer, Developmental Disorder Cell Death and Survival, Connective Tissue Development and Function, Skeletal and Muscular System Development and Function (b) Top Canonical Pathways p-value Acute Phase Response Signaling 2.96E-03 CDP-diacylglycerol Biosynthesis I 5.96E-03 Clathrin-mediated Endocytosis Signaling 1.27E-02 JAK/Stat Signaling 1.44E-02 Calcium Transport I 2.19E-02 Associated Network Functions Lipid Metabolism, Small Molecule Biochemistry, Cell Death and Survival Cell-To-Cell Signaling and Interaction, Nervous System Development and Function, Molecular Transport Cancer, Endocrine System Disorders, Cell Cycle Cellular Development, Cellular Growth and Proliferation, Tumor Lipid Metabolism, Molecular Transport, Small Molecule Biochemistry 1The # Molecules1 18/116 (0.155) 31/258 (0.12) 18/122 (0.148) 49/489 (0.1) 18/124 (0.145) 42 12 10 10 # Molecules 12/164 (0.073) 3/15 (0.2) 11/176 (0.062) 6/68 (0.088) 2/9 (0.222) 29 14 12 9 6 number of molecules for the top canonical pathways is presented as a ratio of molecules that meet the cut-off (p<=0.01) for the significance threshold over all the molecules involved in the pathway. 1


