Modeling Restoration of Eutrophic Lakes
advertisement
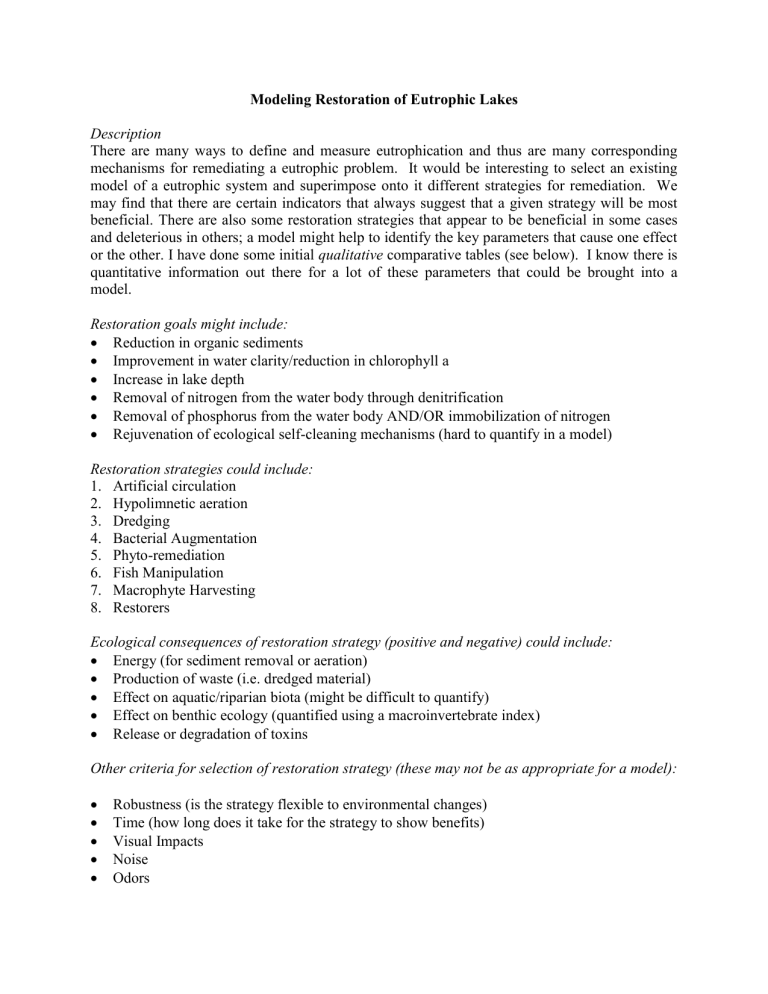
Modeling Restoration of Eutrophic Lakes Description There are many ways to define and measure eutrophication and thus are many corresponding mechanisms for remediating a eutrophic problem. It would be interesting to select an existing model of a eutrophic system and superimpose onto it different strategies for remediation. We may find that there are certain indicators that always suggest that a given strategy will be most beneficial. There are also some restoration strategies that appear to be beneficial in some cases and deleterious in others; a model might help to identify the key parameters that cause one effect or the other. I have done some initial qualitative comparative tables (see below). I know there is quantitative information out there for a lot of these parameters that could be brought into a model. Restoration goals might include: Reduction in organic sediments Improvement in water clarity/reduction in chlorophyll a Increase in lake depth Removal of nitrogen from the water body through denitrification Removal of phosphorus from the water body AND/OR immobilization of nitrogen Rejuvenation of ecological self-cleaning mechanisms (hard to quantify in a model) Restoration strategies could include: 1. Artificial circulation 2. Hypolimnetic aeration 3. Dredging 4. Bacterial Augmentation 5. Phyto-remediation 6. Fish Manipulation 7. Macrophyte Harvesting 8. Restorers Ecological consequences of restoration strategy (positive and negative) could include: Energy (for sediment removal or aeration) Production of waste (i.e. dredged material) Effect on aquatic/riparian biota (might be difficult to quantify) Effect on benthic ecology (quantified using a macroinvertebrate index) Release or degradation of toxins Other criteria for selection of restoration strategy (these may not be as appropriate for a model): Robustness (is the strategy flexible to environmental changes) Time (how long does it take for the strategy to show benefits) Visual Impacts Noise Odors Comparative Tables for Restoration Strategies Table 2.1 Summary of the effectiveness of restoration techniques KEY SLUDGE DIGESTION Macrophyte Harvesting + 0 0 ++ ++ + 0 ++/0 0 +/– – +/– – + 0 – 0 +/– ++/– 0/+ ++ +/0 + ++ +/0 ++/+ ++ + 0 – –– Organic matter is digested in situ. This technique does not affect organic sludge breakdown. Organic matter might build up on the sediment. It is likely that organic matter will build up on the sediment. No effect on water clarity. Turbidity might increase temporarily. Slight decrease in water depth. It is likely that turbidity will increase semipermanently Significant permanent decrease in water depth Nutrients may be added to the water body. WATER CLARITY Water clarity may be permanently improved. INCREASE DEPTH Both inorganic and organic sediment are removed to increase water depth. The nutrient is removed from the water body. Only organic sediments can be removed to increase water body depth. The nutrient may be trapped into nonbioavailable forms. No change in sediment depth. Benefits may be permanent. Benefits may last for several years. Benefits may last for several months. LONGEVITY Lake Restorers™ Food Web Manipulation ++ 0 + ++ 0 0 The technique may indirectly encourage the breakdown of organic matter. Water clarity may be slightly improved. N and P REMOVAL LIVING MACHINES Phytoremediation SLUDGE REMOVAL + + 0 WATER CLARITY 0/+/– +/0 – –/– INCREASE DEPTH +/– +/– ++ N REMOVAL ++/– ++ ++/– P REMOVAL + + ++/– LONGEVITY – –– +/++ Note: Multiple scores are listed by descending probability. BIOMANIPULATION Bacterial Augmentation Dredging Artificial Circulation DREDGING Hypolimnetic Aeration SEDIMENT OXIDATION PERFORMANCE There is no effect on nutrient concentrations Nutrients may be released from sediments or biomass. Benefits may last for several days. No changes after treatment ends. Table 2.2 Summary of environmental effects of restoration techniques Fish Manipulation Macrophyte Harvesting Lake Restorers™ ++ ++ ++ + – + –– –/+ + ++ + ++ 0 ++ – –/++ –– +/– – ++ ++/– ++ ++ – –/0 ++/– ++ – Low energy requirements supplied by non-renewable energy sources. Large amounts of organic waste which required standard disposal. Could initiate algal blooms. –– High energy requirements supplied by non-renewable energy sources. No known effect on benthic ecology. Small or temporary impacts on benthic biota. May directly remove benthic biota. No toxic effects of the technique Release of toxins through suspension of sediments. Direct addition of toxins into the water column. ++ Minimal energy is required for the process. + Energy is required but provided through means of renewable energy. 0 No information. WASTE No waste is produced. Small amounts of waste are produced. No information. AQUATIC/RI PARIAN BIOTA The technique may reduce aquatic weeds and algae or lead to fish growth semi-permanently (years). Increases bacteria near the sediment and benthic macroinvertebrate diversity semipermanently (years). Toxins may be removed from the sediment or water column. The technique may reduce aquatic weeds and algae or lead to fish growth temporarily (less than 1 year). Increases bacteria near the sediment and benthic macroinvertebrate diversity temporarily (less than 1 year). Toxins are stabilized and made non-bioavailable. No known effect on aquatic biota. KEY ENERGY BENTHIC ECOLOGY TOXINS LIVING MACHINES Phytoremediation ENERGY – – –– WASTE ++ ++ –/– – PRODUCTION AQUATIC BIOTA –/+ – –/– – BENTHIC + + – –/+ ECOLOGY TOXINS 0 0 – Note: Multiple scores are listed by descending probability. BIOMANIPULATION Bacterial Augmentation DREDGING Dredging Hypolimneti c Aeration SEDIMENT OXIDATION Artificial Circulation ENVIRONMENTAL CONCERNS Wastes which may contain toxic materials and require special disposal. Could kill aquatic biota important to lake ecology. Table 2.3 Summary of other concerns related to restoration techniques Fish Manipulation Macrophyte Harvesting Lake Restorers™ ROBUSTNESS 0 0 0 TIME + + ++ VISUAL IMPACTS 0 0 – NOISE – – –– ODORS 0/+ 0/+ 0/– Note: Multiple scores are listed by descending probability. LIVING MACHINES Phytoremediation Dredging BIOMANIPULATION Bacterial Augmentation DREDGING Hypolimnetic Aeration Artificial Circulation SEDIMENT OXIDATION – –/+ 0 0 –/+ + – ++ 0 0/+ – + 0 0 – + –– +/– –– 0/+ ++ – ++ – 0/+ ++ + 0 – –– Very flexible to environmental changes. Slightly flexible to environmental changes. No information. Very vulnerable to environmental changes. TIME Changes observed within days of treatment. No information. VISUAL IMPACTS Long-term positive impact. Changes observed within weeks of treatment. Temporary positive impact. Slightly vulnerable to environmental changes. Changes observed within months of treatment. Temporary negative impacts. NOISE Long-term positive impact. Temporary positive impact. No impact. ODORS Long-term positive impact. Temporary positive impact. No impact. KEY ROBUSTNESS No impact. Noise impacts are quiet or temporary. Temporary negative impacts. Changes require at least one year of treatment to take place. Long-term negative impacts. Noise impacts are loud or permanent. Long-term negative impacts.
