Object Type: xgraph Description: Main object class for displaying
advertisement
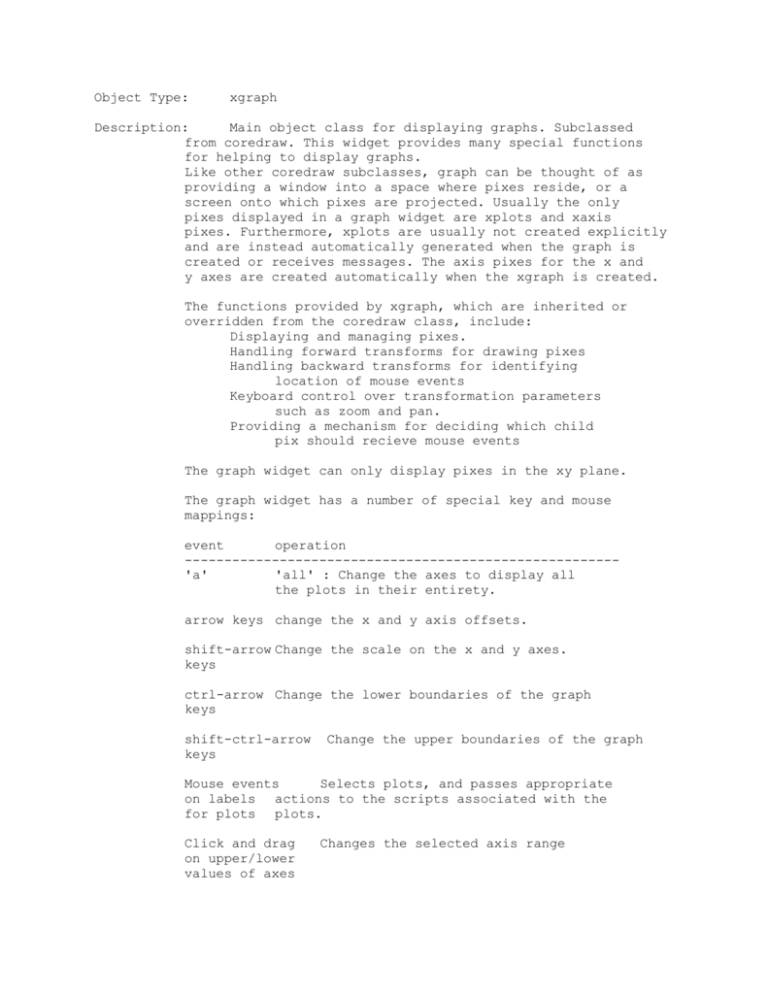
Object Type:
xgraph
Description:
Main object class for displaying graphs. Subclassed
from coredraw. This widget provides many special functions
for helping to display graphs.
Like other coredraw subclasses, graph can be thought of as
providing a window into a space where pixes reside, or a
screen onto which pixes are projected. Usually the only
pixes displayed in a graph widget are xplots and xaxis
pixes. Furthermore, xplots are usually not created explicitly
and are instead automatically generated when the graph is
created or receives messages. The axis pixes for the x and
y axes are created automatically when the xgraph is created.
The functions provided by xgraph, which are inherited or
overridden from the coredraw class, include:
Displaying and managing pixes.
Handling forward transforms for drawing pixes
Handling backward transforms for identifying
location of mouse events
Keyboard control over transformation parameters
such as zoom and pan.
Providing a mechanism for deciding which child
pix should recieve mouse events
The graph widget can only display pixes in the xy plane.
The graph widget has a number of special key and mouse
mappings:
event
operation
------------------------------------------------------'a'
'all' : Change the axes to display all
the plots in their entirety.
arrow keys change the x and y axis offsets.
shift-arrow Change the scale on the x and y axes.
keys
ctrl-arrow Change the lower boundaries of the graph
keys
shift-ctrl-arrow
keys
Change the upper boundaries of the graph
Mouse events
Selects plots, and passes appropriate
on labels actions to the scripts associated with the
for plots plots.
Click and drag
on upper/lower
values of axes
Changes the selected axis range
Click and drag
on middle
values of axes
ctrl-p
Author:
Changes the selected axis offset.
Prints the graph to a postscript
printer/file
Upi Bhalla Mt. Sinai May 93
---------------------------------------------------------------------------ELEMENT PARAMETERS
DataStructure:
Size:
Fields:
xgraph_type [in src/Xodus/graph/xgraph_struct.h]
184 bytes
fg
Foreground color of graph (not used)
Background color.
Position of left edge of graph.
Position of upper edge of graph.
Width of graph
Height of graph
x lower limit for axis for plots. Note that the is
NOT the lower limit of the region in which pixes
can be drawn. That is given by cdxmin.
ymin y lower limit for axis
xmax x upper limit for axis
ymax y upper limit for axis
cdxmin
x lower limit for draw region of graph
bg
xgeom
ygeom
wgeom
hgeom
xmin
cdymin
cdxmax
cdymax
xoffset
y lower limit for
x upper limit for
y upper limit for
X-offset to apply
draw region of graph
draw region of graph
draw region of graph
to successive plots in the
yoffset
Y-offset to apply to successive plots in the
graph.
graph.
overlay Flag for whether or not to save old plots. If
set to 0, old plots are discarde. If set to 1,
old plots are retained and moved into the
subelement 'xoverlay' which is a child of the
graph.
script
Script operation(s) to perform on a mouse
click. The script calls to the graph widget
are only made if none of the child pixes has
expressed an interest in the event.
--------------------------------------------------------------------------SIMULATION PARAMETERS
Function:
XGraph [in src/Xodus/widg/xgraph.c]
Classes:
widget output
Actions:
XUPDATE: update internal fields when
displayed widget is changed.
XOCOMMAND: an action that can invoke the functions
in the 'script' field
XODROP:
Called when a pix is dropped into a draw widget.
ADDMSGIN: Monitors commands for adding messages. If a
PLOT, PLOTSCALE or WAVEPLOT message is received,
the appropriate xplot pixes are created.
Messages:
PLOT
data name color
In this mode successive data points are added to
the end of the plot as the simulation progresses.
PLOTSCALE data name color scale yoffset
Similar to PLOT, except that the scale and yoffset
of this plot are also included in the message.
X
x-coordinate-of-PLOT-msg name-of-corresponding-PLOT-msg
This is used for creating xy (phase) plots. To use
this, first the PLOT msg must be sent, then the
corresponding X msg can be set up. See the
example below.
WAVEPLOT data name color
This is used to create a plot whose y coordinates
vary as the simulation progresses. For example,
if we have 10 waveplot messages with the same name,
they will specify 10 successive y coordinates on
a line. With every timestep the y coordinates get
updated so the effect is like the profile of a
travelling wave.
--------------------------------------------------------------------------Notes:
Can only be displayed in a form widget
The xgraph does not actually handle messages itself.
Instead it forwards them to the appropriate xplot
pix.
Example.
================================= cut here
=================================
//genesis
// This example tests the various graph modes. First click 'runit',
// then click reset and then runit again.
// Click on any of the plots to toggle their visibility
create xform /form [1,1,500,800] -title "OUTPUT" -fg black
ce /form
create xbutton runit
setfield runit script \
"step 1000; setfield /form/instr1 fg black; setfield /form/instr2 fg
blue"
create xbutton reset -wgeom 50% -script reset
create xbutton quit -ygeom 0:runit -xgeom 50% -wgeom 50% -script quit
create xgraph /form/graph -hgeom 30%
ce /form/graph
setfield script "echo in graph" xmin 0 xmax 100 ymin -1 ymax 5
setfield yoffset 2
setfield xmax 1000 ymax 15
setfield overlay 1
create xgraph /form/phasegraph -hgeom 30%
ce /form/phasegraph
setfield script "echo in graph" xmin 0 xmax 100 ymin -1 ymax 5
setfield yoffset 2
setfield xmin -1 xmax 1 ymin -1 ymax 3
setfield overlay 1
create xgraph /form/wavegraph -hgeom 20%
ce /form/wavegraph
setfield script "echo in graph" xmin 0 xmax 100 ymin -1 ymax 5
setfield xmin -0.5 xmax 1.5 ymin -1 ymax 1
create xlabel /form/instr1 \
-label "First click 'runit' to activate the demo." -fg blue
create xlabel /form/instr2 \
-label "After the run ends, click 'reset' and 'runit' again."
create xlabel /form/instr3 \
-label "Click on any of the plot names to toggle their visibility"
int i
create xplot /form/graph/foo
ce /form/graph/foo
for(i = 0; i < 200 ; i = i + 1)
setfield xpts->table[{i}] {i}
setfield ypts->table[{i}] {sin {i/10.0} }
end
setfield npts 200 fg blue wx 1 wy 1
//set xmin 0 xmax 100 ymin -1 ymax 1 wx 1 wy 1
ce ..
create table /tab
call /tab TABCREATE 400 0 400
setfield /tab step_mode 1 stepsize 1
for(i = 0; i < 400 ; i = i + 1)
setfield /tab table->table[{i}] {cos {5+ i/30.0} }
end
create table /tab2
call /tab2 TABCREATE 400 0 400
setfield /tab2 step_mode 1 stepsize 1
for(i = 0; i < 400 ; i = i + 1)
setfield /tab2 table->table[{i}] {sin {4 +i/16.0} }
end
addmsg /tab /form/graph PLOT output *output *yellow
addmsg /tab2 /form/graph PLOT output *output *green
addmsg /tab2 /form/graph PLOTSCALE output *plotscale *red -0.5 0.5
addmsg /tab /form/phasegraph PLOT output *output *yellow
addmsg /tab2 /form/phasegraph X output *output
addmsg /tab /form/wavegraph WAVEPLOT output *wave *blue
addmsg /tab2 /form/wavegraph WAVEPLOT output *wave *blue
setfield /form/#[TYPE=xgraph]/#[TYPE=xplot] script "toggle_visibility
<w>"
function toggle_visibility(widget)
str widget
if ({getfield {widget} pixflags} & 1)
setfield {widget} pixflags ~v
else
setfield {widget} pixflags v
end
end
xshow /form
================================= cut here
=================================
See also:
xplot, xaxis, XODUS documentation, pix documentation,
documentation for coredraw and other subclasses.
