probabilistic input
5
Probabilistic Design
Plate under transverse load
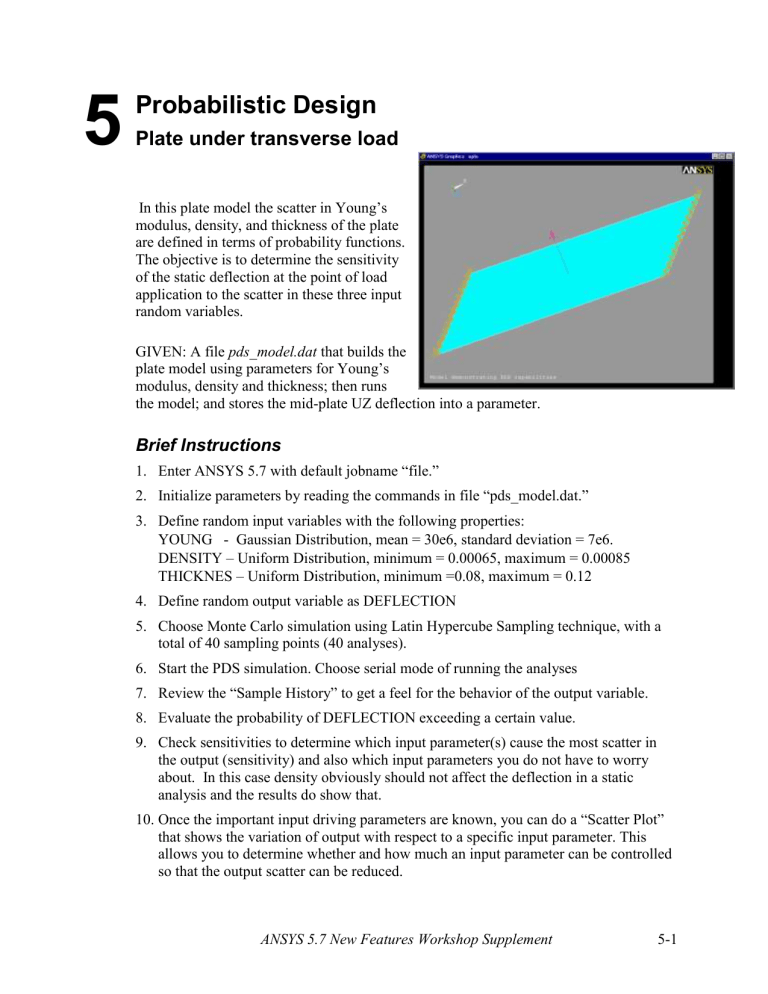
In this plate model the scatter in Young’s modulus, density, and thickness of the plate are defined in terms of probability functions.
The objective is to determine the sensitivity of the static deflection at the point of load application to the scatter in these three input random variables.
GIVEN: A file pds_model.dat
that builds the plate model using parameters for Young’s modulus, density and thickness; then runs the model; and stores the mid-plate UZ deflection into a parameter.
Brief Instructions
1.
Enter ANSYS 5.7 with default jobname “file.”
2.
Initialize parameters by reading the commands in file “pds_model.dat.”
3.
Define random input variables with the following properties:
YOUNG - Gaussian Distribution, mean = 30e6, standard deviation = 7e6.
DENSITY – Uniform Distribution, minimum = 0.00065, maximum = 0.00085
THICKNES – Uniform Distribution, minimum =0.08, maximum = 0.12
4.
Define random output variable as DEFLECTION
5.
Choose Monte Carlo simulation using Latin Hypercube Sampling technique, with a total of 40 sampling points (40 analyses).
6.
Start the PDS simulation. Choose serial mode of running the analyses
7.
Review the “Sample History” to get a feel for the behavior of the output variable.
8.
Evaluate the probability of DEFLECTION exceeding a certain value.
9.
Check sensitivities to determine which input parameter(s) cause the most scatter in the output (sensitivity) and also which input parameters you do not have to worry about. In this case density obviously should not affect the deflection in a static analysis and the results do show that.
10.
Once the important input driving parameters are known, you can do a “Scatter Plot” that shows the variation of output with respect to a specific input parameter. This allows you to determine whether and how much an input parameter can be controlled so that the output scatter can be reduced.
ANSYS 5.7 New Features Workshop Supplement 5-1
Detailed Instructions
1.
Start ANSYS 5.7 with the default jobname (file).
2.
Read input from the file pds_model.dat
. This runs the analysis once and initializes the various parameters used in the probabilistic design analysis. The three input random variables created are YOUNG for Young’s modulus, DENSITY for density, and THICKNES for the plate thickness. The output parameter that we are interested in is the mid-plate UZ displacement and is called DEFLECTION.
Click on:
File > Read Input From … pds_model.dat
[OK]
3.
Enter the PDS module and point to pds_model.dat
as the analysis file used in looping.
Click on:
Main Menu > Prob Design … > -Looping File- Assign pds_model.dat
[OK]
4.
Define random INPUT variables. Start with Young’s modulus:
Click on:
Prob Design … >Random Input … >Add
Name = YOUNG
TYPE = GAUSS
[OK]
MEAN = 30e6
SIGMA = 7e6
5.
Follow step 4 above and specify DENSITY and THICKNES as random input variables that vary according to UNIFORM probability distribution. DENSITY ranges between 0.00065 and 0.00085. THICKNES ranges between 0.08 and 0.12.
5-2 ANSYS 5.7 New Features Workshop Supplement
6.
Define random OUTPUT variable, in this case, the parameter DEFLECTION.
Click on:
Prob Design … >Random Output … >Add
Choose DEFLECTION [OK]
7.
Specify the Probabilistic Simulation method to use ( Monte Carlo or Response
Surface). We will use Monte Carlo method in this case.
Click on:
Prob Design … > -Prob Methods- Monte Carlo Sims … > Latin
Hypercube [OK]
NSIM = 40
8.
Run probabilistic simulation.
Click on:
Prob Design … > Run > -Exec Serial- Run Serial
Slab Solution Set Label = DEMO1
[OK]
[OK] on the next panel to start running the simulation
ANSYS 5.7 New Features Workshop Supplement 5-3
9.
Review PDS results. Start by looking at the SAMPLE HISTORY data for mean , standard deviation etc. These indicate whether adequate number of samples have been used. NOTE that for Monte Carlo simulation method the sample size does not depend on the number of input random variables. You can also evaluate the probability of DEFLECTION exceeding a certain value for example at this point.
Click on:
Prob Design … > -Prob Results- Statistics > Sample History
5-4 ANSYS 5.7 New Features Workshop Supplement
10.
Look at sensitivity of DEFLECTION to each of the INPUT parameters.
Click on:
Prob Design … > -Prob Results- Trends > Sensitivities …
The sensitivity plot shows as expected that DEFLECTION is not sensitive to DENSITY since this is a static analysis.
DEFLECTION has a strong negative correlation to both YOUNG and THICKNES.
ANSYS 5.7 New Features Workshop Supplement 5-5
5-6 ANSYS 5.7 New Features Workshop Supplement

