Name
advertisement
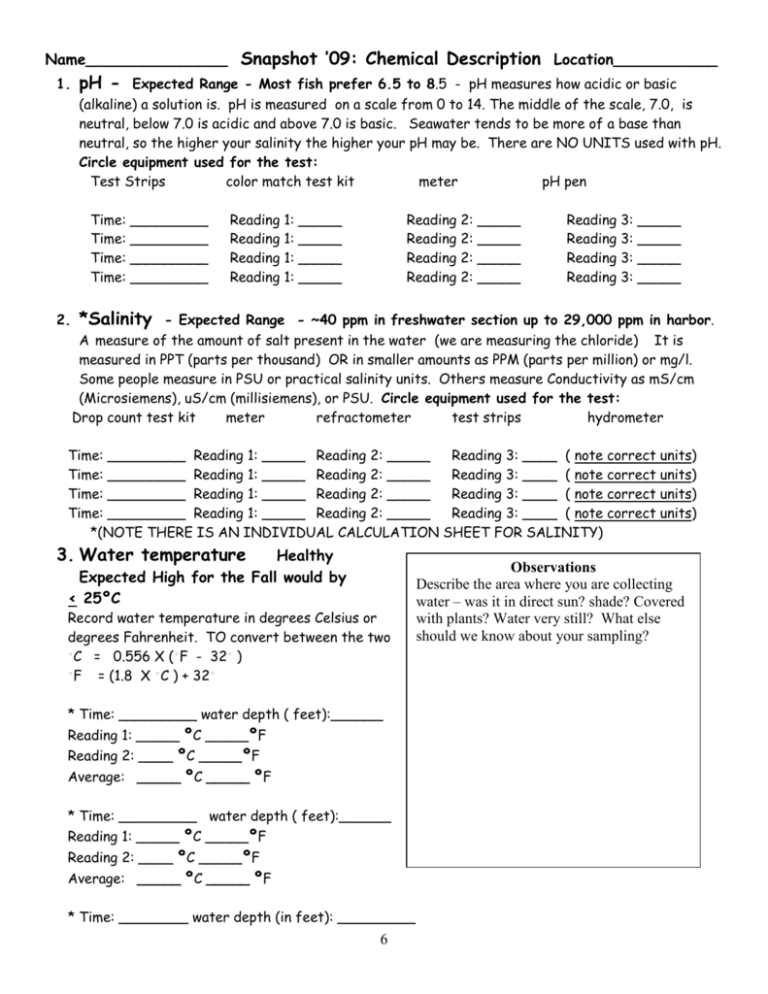
Name_______________ Snapshot ’09: Chemical Description Location___________ 1. pH - Expected Range - Most fish prefer 6.5 to 8.5 - pH measures how acidic or basic (alkaline) a solution is. pH is measured on a scale from 0 to 14. The middle of the scale, 7.0, is neutral, below 7.0 is acidic and above 7.0 is basic. Seawater tends to be more of a base than neutral, so the higher your salinity the higher your pH may be. There are NO UNITS used with pH. Circle equipment used for the test: Test Strips color match test kit meter pH pen Time: _________ Time: _________ Time: _________ Time: _________ 2. Reading 1: _____ Reading 1: _____ Reading 1: _____ Reading 1: _____ Reading 2: _____ Reading 2: _____ Reading 2: _____ Reading 2: _____ Reading 3: _____ Reading 3: _____ Reading 3: _____ Reading 3: _____ *Salinity - Expected Range - ~40 ppm in freshwater section up to 29,000 ppm in harbor. A measure of the amount of salt present in the water (we are measuring the chloride) It is measured in PPT (parts per thousand) OR in smaller amounts as PPM (parts per million) or mg/l. Some people measure in PSU or practical salinity units. Others measure Conductivity as mS/cm (Microsiemens), uS/cm (millisiemens), or PSU. Circle equipment used for the test: Drop count test kit meter refractometer test strips hydrometer Time: _________ Reading 1: _____ Reading 2: _____ Reading 3: ____ ( note correct units) Time: _________ Reading 1: _____ Reading 2: _____ Reading 3: ____ ( note correct units) Time: _________ Reading 1: _____ Reading 2: _____ Reading 3: ____ ( note correct units) Time: _________ Reading 1: _____ Reading 2: _____ Reading 3: ____ ( note correct units) *(NOTE THERE IS AN INDIVIDUAL CALCULATION SHEET FOR SALINITY) 3. Water temperature Healthy Expected High for the Fall would by < 25ºC Record water temperature in degrees Celsius or degrees Fahrenheit. TO convert between the two ◦ C = 0.556 X (◦F - 32◦ ) ◦ F = (1.8 X ◦C ) + 32◦ * Time: _________ water depth ( feet):______ Reading 1: _____ ºC _____ºF Reading 2: ____ ºC _____ºF Average: _____ ºC _____ ºF * Time: _________ water depth ( feet):______ Reading 1: _____ ºC _____ºF Reading 2: ____ ºC _____ºF Average: _____ ºC _____ ºF * Time: ________ water depth (in feet): _________ 6 Observations Describe the area where you are collecting water – was it in direct sun? shade? Covered with plants? Water very still? What else should we know about your sampling? Name_______________ Snapshot ’09: Chemical Description Location___________ Reading 1: _____ ºC _____ºF Reading 2: ____ ºC _____ºF Average: _____ ºC _____ ºF 4. Dissolved oxygen (DO) Healthy Expected Range 5.0-11.0 mg/L The amount of dissolved oxygen in the water is one of the most important factors in telling how healthy that ecosystem is. Many variables affect DO, including temperature, time of day, presence of plants, and wind conditions. DO measurements are given in mg/l and as percent saturation. 100% saturation means that the water cannot hold any more oxygen at that temperature. If more oxygen is added (such as by a high wind or a waterfall) the oxygen will go from the water into the air. Circle equipment used for the test: meter drop count kit other For test temperature use average from #3 above. For % saturation calculation use chart on bottom of page. * Time: _______Water temperature in ºC ____ DO (mg/l) or PPM: ____% saturation _______ * Time: _______Water temperature in ºC ____ DO (mg/l) or PPM: ____% saturation _______ * Time: _______Water temperature in ºC ____ DO (mg/l) or PPM: ____% saturation _______ 5. % Saturation of Dissolved Oxygen (DO) Healthy Expected Range 90% or above Source of chart: http://waterontheweb.org/under/waterquality/oxygen.html For a quick and easy determination of the percent saturation value for dissolved oxygen at a given temperature, use the saturation chart below. Locate your DO reading on the bottom scale (ppm equals mg/L). Locate the temperature of the water in degrees C on the top scale. Draw a straight line between the temperature and DO. The % saturation is the value where the line intercepts the saturation scale. QuickTime™ and a TIFF (Uncompressed) decompressor are needed to see this picture. 7
