Geophysical stratigraphy
advertisement

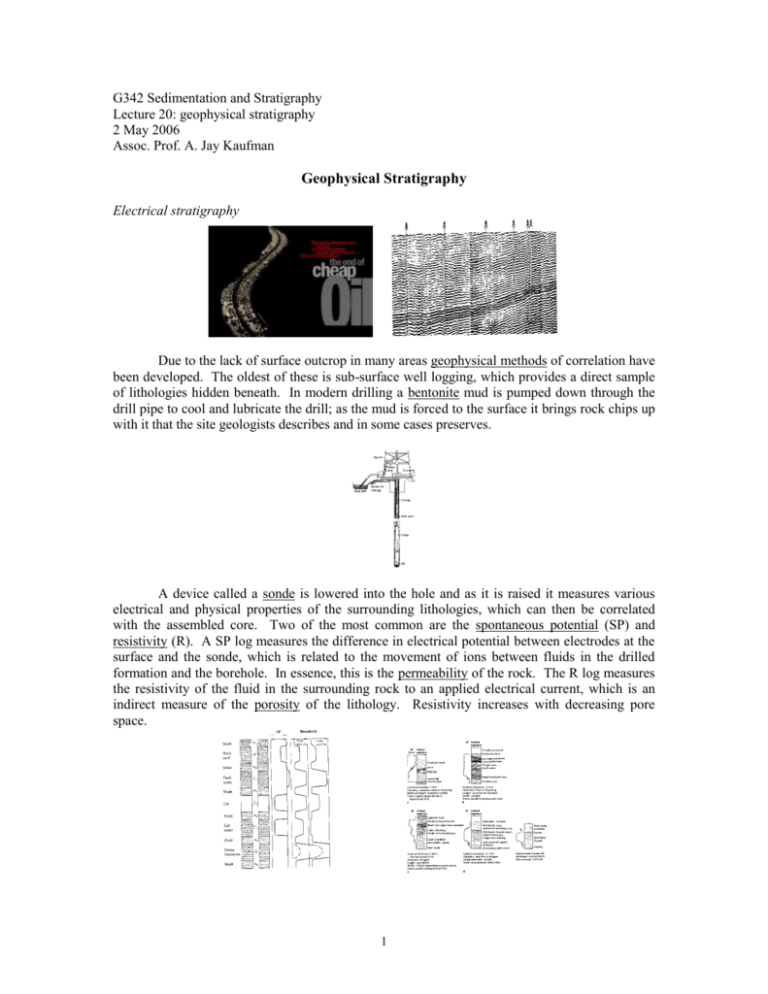
G342 Sedimentation and Stratigraphy Lecture 20: geophysical stratigraphy 2 May 2006 Assoc. Prof. A. Jay Kaufman Geophysical Stratigraphy Electrical stratigraphy Due to the lack of surface outcrop in many areas geophysical methods of correlation have been developed. The oldest of these is sub-surface well logging, which provides a direct sample of lithologies hidden beneath. In modern drilling a bentonite mud is pumped down through the drill pipe to cool and lubricate the drill; as the mud is forced to the surface it brings rock chips up with it that the site geologists describes and in some cases preserves. A device called a sonde is lowered into the hole and as it is raised it measures various electrical and physical properties of the surrounding lithologies, which can then be correlated with the assembled core. Two of the most common are the spontaneous potential (SP) and resistivity (R). A SP log measures the difference in electrical potential between electrodes at the surface and the sonde, which is related to the movement of ions between fluids in the drilled formation and the borehole. In essence, this is the permeability of the rock. The R log measures the resistivity of the fluid in the surrounding rock to an applied electrical current, which is an indirect measure of the porosity of the lithology. Resistivity increases with decreasing pore space. 1 A dipmeter is another geophysical tool that measures resistivity in four directions, thus providing information about the attitude of the strata. This information helps in the recognition of sub-surface folds and faults, and in paleoenvironmental interpretation. A gamma ray log measures the natural radioactivity of the strata, usually associated with the decay of 40K in minerals of the surrounding rocks. This method is sensitive to rocks that are high in potassium, thus shale and arkose, as well as muddy and lithic sandstone give high gamma ray values. Seismic stratigraphy Long used to determine the interior structure of the Earth, seismic stratigraphy has become the most powerful tool in oil field stratigraphy. With this tool, it is currently possible to: 1) 2) 3) 4) 5) recognize the shape of stratigraphic sequences interpret their depositional histories recognize unconformities and reconstruct transgressional-regressional history of an area detect fluid contents of rock identify hydrocarbon accumulations In both two and three dimensional imagery one is now able to resolve areas of tens to hundreds of meters. 2 Peter Vail contributed mightily to the science of sequence stratigraphy, but in essence created the science of seismic stratigraphy. His enormous contribution came from a key conceptual breakthrough – that seismic reflections approximate chronostratigraphic surfaces. Key Terms: reflector: A boundary that creates a seismic reflection (see impedance contrast) reflection: The acoustic waves created by sound bouncing off of a reflector. impedance: A physical rock property of sound propagating through rock. impedance contrast: A physical boundary within rocks producing a reflection. It does NOT have to be a rock boundary, and can be a fluid contact, a diagenetic effect, or other. A positive impedance contrast produces a positive reflection, a negative impedance contrast the opposite. wavelet: The acoustic wave which, when convolved with impedance boundaries, produces a reflection impedance = rock velocity * rock density Seismic attribute: The “wiggles” of seismic reflections (traces) have a number of aspects that can be measured: amplitude, duration (in two-way travel time), area, etc. These attributes can be quantified and mapped. Those numerical and map results show tremendous potential to predict subsurface characteristics of rocks. Reflection seismology is the science of making a big bang and listening for its echoes. Sound waves travel in all directions, but only those that travel almost directly downward. On land, the returning sound wave is detected by a geophone. 3 Seismic profiles are not stratigraphic cross sections. The vertical scale is two way travel time. If the seismic velocity is the same in all the underlying rocks then the travel time and thickness are linearly related. A seismic reflection is made by a change in seismic velocity, usually due to a density contrast, or acoustic impedence. Seismic sequences are analyzed by marking the unconformities in a seismic section and determining their degree of onlap or offlap and their ages. These can then be plotted as a series of unconformity-bounded sequences with a time axis. The lateral extents of the units are shown in the image, while the missing time is represented by the vertical lines. From this diagram, a curve of relative onlap and offlap can be constructed, which inform us about relative sea level change through time. The most widely applied use of seismic stratigraphy is in the interpretation of unconformities. Each unconformity bounded package on a seismic profile is called a seismic sequence. After a number of passive margin sequences were analyzed it was noted that the age and magnitude of unconformities were about equal, suggesting a global control, which was inferred to be sea level. Hence sea level curves through all of the Phanerozoic have been constructed from seismic stratigraphy. 4


