Experiment Design:
advertisement
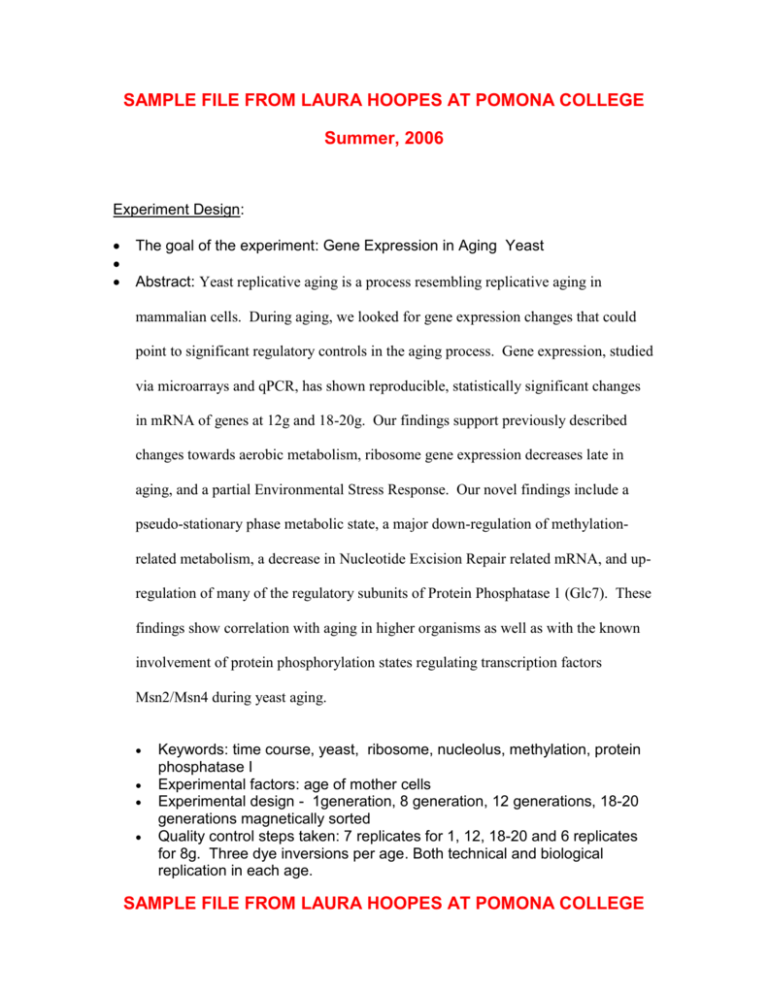
SAMPLE FILE FROM LAURA HOOPES AT POMONA COLLEGE Summer, 2006 Experiment Design: The goal of the experiment: Gene Expression in Aging Yeast Abstract: Yeast replicative aging is a process resembling replicative aging in mammalian cells. During aging, we looked for gene expression changes that could point to significant regulatory controls in the aging process. Gene expression, studied via microarrays and qPCR, has shown reproducible, statistically significant changes in mRNA of genes at 12g and 18-20g. Our findings support previously described changes towards aerobic metabolism, ribosome gene expression decreases late in aging, and a partial Environmental Stress Response. Our novel findings include a pseudo-stationary phase metabolic state, a major down-regulation of methylationrelated metabolism, a decrease in Nucleotide Excision Repair related mRNA, and upregulation of many of the regulatory subunits of Protein Phosphatase 1 (Glc7). These findings show correlation with aging in higher organisms as well as with the known involvement of protein phosphorylation states regulating transcription factors Msn2/Msn4 during yeast aging. Keywords: time course, yeast, ribosome, nucleolus, methylation, protein phosphatase I Experimental factors: age of mother cells Experimental design - 1generation, 8 generation, 12 generations, 18-20 generations magnetically sorted Quality control steps taken: 7 replicates for 1, 12, 18-20 and 6 replicates for 8g. Three dye inversions per age. Both technical and biological replication in each age. SAMPLE FILE FROM LAURA HOOPES AT POMONA COLLEGE Publication currently being submitted; links can be made. Data will be stored on the GCAT server at Davidson College for public access. Samples used, extract preparation and labeling: The origin of each biological sample (Saccharomyces cerevisiae W303Ra wild type from Rodney Rothstein) and its characteristics (haploid, mating type a, ages 1, 8, 12, and 18-20g). Manipulation of biological samples and protocols used: all cultures kept in log phase by growing to less than or equal to 0.8 A600 in each growth cycle; magnetic sorting; sorting method by mother cell wall biotinylation and Miltenyi magnetic sorting according to Chen, C, Dewale, S, Braeckman, B, Desmyter, L, Verstraelen, J, Borgonie, J, and Contreras, R. A high-throughput screening system for genes extending life-span. Exp Gerontol. 38:1051-1063 (2003). Each culture matched with log phase young culture subjected to all the same conditions as the age-sorted cells. Experimental factor value for each experimental factor, for each sample: generations determined by average calcofluor-stained bud scars; each array has the generation as the first number in the array name, for example 1amp1 is the first array for 1 generation cells. Technical protocols for preparing the hybridization extract: Total RNA extracted via grinding with 0.5 um acid washed glass beads and purification using Qiagen RNeasy kits with DNase I treatment on columns. Quality control for RNA include 260/280> 1.80, rRNA bands on agarose gel with sharp bands where the larger rRNA is heavier than the smaller and there is a haze of mRNA in background. mRNA amplification and labeling using the Ambion kit, with additional Cy dye from Amersham. Hybridization procedures and parameters: Hybridization under Erie Lifter slips in 1x DigEasy hybridization solution (Roche) with denatured Calf Thymus DNA, yeast tRNA, and oligo dA for 16h at 37 degrees in a dark holder with hydration wells. Washes were in 55 degree 1x SSC/0.1% SDS 5 minutes rocking under foil; room temperature 1xSSC/0.1% SDS 5 minutes rocking under foil; 55 degree 0.5x SSC 5 minutes rocking under foil, 0.1x SSC 2 minutes under foil, SAMPLE FILE FROM LAURA HOOPES AT POMONA COLLEGE inverting tube twice during time, dip twice into MilliQ water and immediately centrifuge 5 min in clinical centrifuge to dry. Measurement data and specifications: Data o o Data were scanned on Axon GenePix 4000B and attached to the gal file for the microarrays provided by GCAT. Each row of the imager output is related to the features in the array summary information. GenePix 5.1 software was used to image, collect intensities, and generate quality control information. The quality control limits used in this study are given below. Quality Control Limits for All Microarrays Median signal Mean of to median Median Signal to background >2.5 background <500 Feature variation Bkgrd variation <0.5 <1.2 Noise >4 Features w saturat'd pixels <3.3% Median % >B +1 StdDev >90 Not Found Bad features <18% <7% Data extraction and processing protocols o Image scanning hardware and software, and processing procedures and parameters. o Normalization, transformation and data selection procedures and parameters: were imported into BRB ArrayTools, BioConductor (R), and GenMAPP/MAPPFinder. For the first two, gpr files were imported. Intensities less than 100 were set to 100. Flagged data were removed. For GenMAPP/MAPPFinder, the median ratio to 1g log phase cells was imported. In BRBArrayTolls and BioConductor, loess smoothing was performed and log base 2 of the data were then obtained for analysis. In GenMAPP/MAPPFinder, no smoothing was used and the selection criterion was set for three fold changes in expression relative to 1g log phase cells. Array Design: Available from GCAT for Washington University Yeast Arrays. General array design, including the platform type (whether the array is a spotted glass array, an in situ synthesized array, etc.); surface and coating specifications and spotting protocols used (for custom made arrays), or SAMPLE FILE FROM LAURA HOOPES AT POMONA COLLEGE product identifiers (the name or make, catalogue reference numbers) for commercially available arrays. Spotted on glass slides. 70mer oligos printed on epoxy slides Array feature and reporter annotation, normally represented as a table (for instance see Tables 1, 2 below), including o For each feature (spot) on the array, its location on the array (e.g., metacolumn, metarow, column, row) and the reporter present in the location (note that the same reporter may be present on several features). o For each reporter unambiguous characteristics of the reporter molecule, including Reporter role – control or measurement The sequence for oligonucleotide based reporters The source, preparation and database accession number for long (e.g., cDNA or PCR product based) reporters Primers for PCR product based reporters o Appropriate biological annotation for each reporter, for instance a gene identifier or name (note that different reporters can have the same biological annotation) Principal array organism(s): budding yeast Saccharomyces cerevisiae. Oligos were based on sequencing of S268C wild type and the RNA was prepared from W303Ra wild type. SAMPLE FILE FROM LAURA HOOPES AT POMONA COLLEGE


