Chetco River Phase 1 Determination Table
advertisement
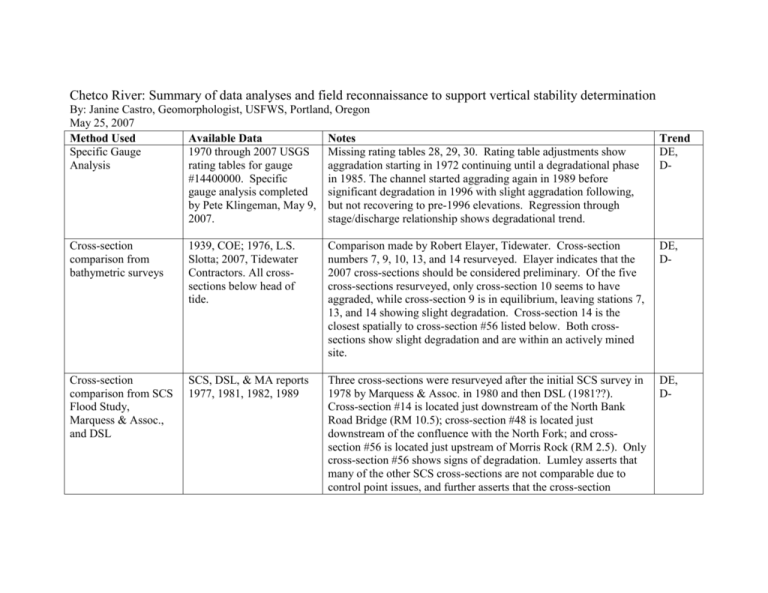
Chetco River: Summary of data analyses and field reconnaissance to support vertical stability determination By: Janine Castro, Geomorphologist, USFWS, Portland, Oregon May 25, 2007 Method Used Available Data Notes Specific Gauge 1970 through 2007 USGS Missing rating tables 28, 29, 30. Rating table adjustments show Analysis rating tables for gauge aggradation starting in 1972 continuing until a degradational phase #14400000. Specific in 1985. The channel started aggrading again in 1989 before gauge analysis completed significant degradation in 1996 with slight aggradation following, by Pete Klingeman, May 9, but not recovering to pre-1996 elevations. Regression through 2007. stage/discharge relationship shows degradational trend. Trend DE, D- Cross-section comparison from bathymetric surveys 1939, COE; 1976, L.S. Slotta; 2007, Tidewater Contractors. All crosssections below head of tide. Comparison made by Robert Elayer, Tidewater. Cross-section numbers 7, 9, 10, 13, and 14 resurveyed. Elayer indicates that the 2007 cross-sections should be considered preliminary. Of the five cross-sections resurveyed, only cross-section 10 seems to have aggraded, while cross-section 9 is in equilibrium, leaving stations 7, 13, and 14 showing slight degradation. Cross-section 14 is the closest spatially to cross-section #56 listed below. Both crosssections show slight degradation and are within an actively mined site. DE, D- Cross-section comparison from SCS Flood Study, Marquess & Assoc., and DSL SCS, DSL, & MA reports 1977, 1981, 1982, 1989 Three cross-sections were resurveyed after the initial SCS survey in 1978 by Marquess & Assoc. in 1980 and then DSL (1981??). Cross-section #14 is located just downstream of the North Bank Road Bridge (RM 10.5); cross-section #48 is located just downstream of the confluence with the North Fork; and crosssection #56 is located just upstream of Morris Rock (RM 2.5). Only cross-section #56 shows signs of degradation. Lumley asserts that many of the other SCS cross-sections are not comparable due to control point issues, and further asserts that the cross-section DE, D- comparison is not appropriate for determination of vertical stability. Cross-section comparison from South Coast mining site South Coast Lumber 2003, 2004, and 2005. Crosssections of the mined bar pre- and post-mining; does not include the active channel. Post-mining recovery to same elevation 2003 through 2005 for cross-sections 0+00, 1+00, 2+00, 3+00, 4+00, 5+00, 6+00, 7+00, 8+00, 9+00, 10+00, and12+00. Cross-section 11+00 did not recover to 2003 levels in either 2004 or 2005 – it is approximately 1-foot lower in elevation. N/A Planform analysis at upper Tidewater site near USGS gauge Aerial photos 1976, 1978 (IR), 1979, 1986, 1991, 1994. The four bars downstream of the bridge show minimal change. The mined bar upstream of the bridge shows a change in the cross-over position. Bars upstream from the mined bar show no change. All bars are boundary forced due to the narrow valley width and probably have a backwater effect on the USGS gauge due to a downstream constriction (per Pete Klingeman). DE Planform analysis near Emily Creek Aerial photos 1939, 1982, 1986, 1990, and 1994. Bar form seems to be stable since the 1964 flood. Emily Creek confluence is perched and disconnected from main stem in all years. DE Bank stabilization Permit requests from COE back to 1983, field investigation 16 COE permitted projects, 9 of which occur between RM 2.0 and 4.9. Field evidence of numerous unpermitted projects, but total length of stabilization has not been quantified. Much of the rock placement appears to be related to stabilization and protection of North Bank Road. Extensive riprap and groins along the lower Chetco. Most rock was end dumped and not keyed in to bed. Failures appear to result from revetment design and installation, not undermining of the structure. Bank instability is due primarily to lateral channel migration. N/A Riparian vegetation Aerial photos various years, field investigation No trend detectable. The constrained valley form results in frequent disturbance to vegetation establishment on depositional bars. N/A Streambed sediment patterns / depositional bars Aerial photos 1940 to 2002, field investigation, Klingeman 2002, Lumley. From RM 11.0 down to RM 7.0, the channel has been very stable with gravel bars in approximately the same location with channel width is maintained over time. This is supported by the Lumley and Klingeman reports. RM 7.0 downstream to RM 2.5 is dynamic and much wider and shallower than upstream. Much bank stabilization has occurred in this reach. From head of tide downstream, there appears to be a decrease in at least one substantial bar. A-, DE Water supply systems Lumley report, DSL 1982 Letter, Wheeler pers. comm. 2007 City of Brookings water intake moved 2 miles upstream. This apparently was due to drought conditions and an increase in withdrawals causing brackish water to enter the system. Harbor Rural Water District concerned about decreased water level in their well. N/A Bridge Repair/Maintenance Inspection records 2005 & 2006 In 2005 structure was listed as in “acceptable condition”. In 2006 the underwater inspection found no piers exposed and no maintenance required. Maximum depth = 9 feet DE Bridge Piers Field investigation Bridge piers located at RM 6.5, approximately 2 to 3-feet exposed above water surface at 650 cfs. Some decking still in place DE Bedload Transport vs. Extraction Ogden Beeman Report, 1981, & Lumley Report Bedload transport calculation using the Einstein equation resulted in a theoretical potential of 372,000 cy/yr average transport (this assumes no limit of source material). The highest estimate is 840,000 cy for 1974, and the low estimate is 22,000 cy for 1977. Permitted extraction as of 2005 was 235,000 cy/yr. Permitted extraction from 1976 to 1980 exceeded 3.5 million cy/yr, although DSL reports only 240,000 cy were actually removed in 1980. D or A, dependi ng on year According to Pete Klingeman, “it is my opinion that the Chetco River could have supported the same uses in 1859 as it is capable of supporting today.” DE Floodplain elevation & Field investigation bar elevation estimating bar height relative to water surface elevation Bar heights ranged from 5 to 12 feet in elevation above the water surface (all bar heights relative to the water surface elevation during the field investigation). Bar height is directly related to floodplain extent and channel constriction. Constrained reaches, such as RM 11.0 to RM 7.0, have relatively high bars (10 to 12 feet), while unconstrained reaches downstream of RM 7.0 generally have lower bars (5 to 8 feet). The lowest bars encountered were located at Freeman Bar and measured approximately 4 to 5 feet in height. Several comparisons of bar height to floodplain height showed coupling of these elevations with the floodplain being only one to two feet above fully developed bar formations. DE Buried soil horizons Field investigation A soil horizon buried by a reent deposit of gravel and sand was observed at Freeman Bar on the left bank. A-, DE Tributary junctions with the mainstem Chetco Field investigation During the field investigation, tributary junctions were inspected for evidence of incision or aggradation. All tributaries encountered (Emily Creek, Dry Creek, Mill Creek, North Fork Jack’s Creek, and Joe Hall Creek, plus several smaller tributaries) had moderate to abundant sediment deposited as fans into the main channel. The larger tributary fans (Emily and North Fork) projected into the main channel and affected the thalweg location, while the smaller fans were scoured to a steep face in alignment with the main channel. No headcuts were evident in the tributaries. A Changes in navigability Klingeman reports – affidavit and hydrologic/hydraulic/morp hologic analyses, 1993 Bed material sorting and armoring Field investigation Most depositional bars were slightly armored but showed no signs of significant imbrication. Sediment size was heterogeneous from sand to cobble. The channel bed where visible was a mix of sizes with limited patchiness, and with sand over gravel in many locations. * A = aggrading, D = degrading, DE = dynamic equilibrium (-/+ indicate limited (-) or excessive (+)) DE, A-
