8_Antkowiak\8_Antkowiak_figures
advertisement
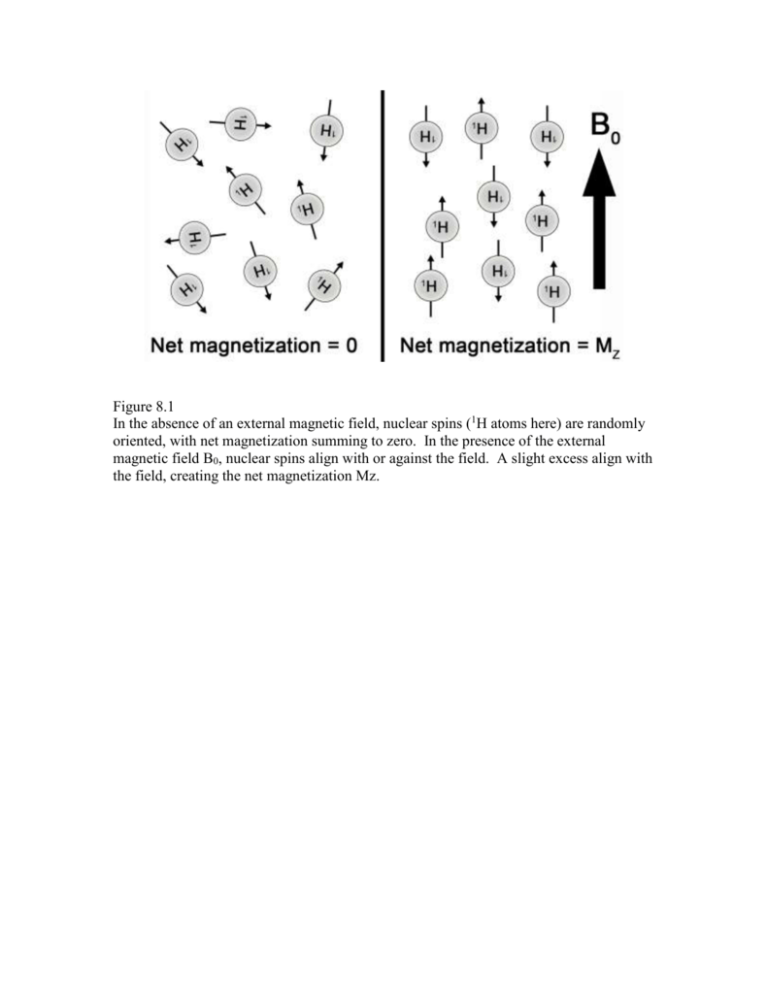
Figure 8.1 In the absence of an external magnetic field, nuclear spins (1H atoms here) are randomly oriented, with net magnetization summing to zero. In the presence of the external magnetic field B0, nuclear spins align with or against the field. A slight excess align with the field, creating the net magnetization Mz. Figure 8.2 Nuclear spins precess about the external magnetic field B0 at the Larmor frequency f0. Figure 8.3 A pulse of radiofrequency energy applied at the Larmor frequency f0 tips longitudinal magnetization away from the z-axis by the flip angle θ, creating transverse magnetization Mxy. The transverse magnetization continues to precess at the Larmor frequency. Figure 8.4 A free induction decay (FID, solid line) is induced in an RF coil by magnetization precessing in the transverse plane. The FID decays exponentially through time due to T2* relaxation (dashed line). Figure 8.5 Longitudinal magnetization Mz recovers due to T1 relaxation. At time T1, the longitudinal magnetization has recovered from zero to 63% of its equilibrium magnetization M0. Figure 8.6 Due to small variations in the main magnetic field, magnetic susceptibility, and spin-spin interactions, there is variation in the precession frequency of the magnetization. Some transverse magnetization precesses exactly at the center frequency f0, some magnetization precesses at faster frequencies such as f0 + Δf, and some at slower frequencies such as f0 Δf. The net result is a loss of phase coherence for the transverse magnetization, and an exponentially decreasing signal that occurs more rapidly than T1 relaxation. Figure 8.7 The presence of a contrast agent enhances a) T1 relaxation or b) T2 relaxation. Relative to the signal intensity without the contrast agent (dashed lines), T1-shortening (solid line) yields higher signal intensity on T1-weighted images, and T2-shortening (solid line) yields lower signal intensity on T2-weighted images. Figure 8.8 A composite volume of tissue is composed in this example of 2 equally-sized compartments. a). Compartment A has a short T1 relaxation time (T1A = 100 msec, top) and compartment B has a longer relaxation time (T1B = 500 msec, bottom). b). Comparison of tissue T1 relaxation with slow water exchange (dot-dash line) and fast water exchange (solid line). In fast exchange, the longitudinal magnetization of the composite tissue volume returns to equilibrium sooner than in slow exchange. Fast exchange results in greater signal enhancement relative to slow exchange. Figure 8.9 Axial gradient echo image of a baboon abdomen. SPIO-labeled transplanted pancreatic islets (white arrow) appear as a large region of hypointense signal beneath the kidney capsule. With kind permission from Anna Moore. Figure 8.10 Glucose-stimulated insulin release in the β cell, and applications for Mn2+-enhanced MRI. Glucose enters the β cell through a GLUT2 transporter, where it undergoes glycolysis. Further down the pathway, this depolarizes the β cell and opens voltage-gated Ca2+ channels. Ca2+ ion (small white circles) influx stimulates insulin release. Mn2+ (small gray circles) enters the β cell through voltage-gated Ca2+ channels due to similar ion size and valence. Figure 8.11 Mn2+-enhanced magnetic resonance (MR) images of mouse pancreas. A: gradient-echo anatomic reference image. B: precontrast inversion recovery image with the pancreas nulled. C and D: inversion recovery images acquired 5 min (C) and 45 min (D) after injection of MnCl2. Signal intensity in the pancreas initially increased rapidly and reached a plateau 15 min after injection of MnCl2. Arrows indicate location of the pancreas. (Reprinted from Antkowiak, PF et al. Am J Physiol Metab 2009; 296: E573578) Figure 8.12 Normalized time-signal intensity curves (TICs) for the pancreas after saline and glucose infusions in normal mice. Mn2+-enhanced MR signal in the pancreas (normalized to liver signal) after saline and glucose infusions is plotted vs. time after MnCl2 injection. Arrow denotes time of injection for saline/glucose, and MnCl2 was injected at time = 0 min. Data points represent means ± SE from 5 mice. (Reprinted from Antkowiak, PF et al. Am J Physiol Metab 2009; 296: E573-578.) Figure 8.13 Normalized TICs for the pancreas after saline and glucose infusions in STZ-diabetic mice. Mn2+-enhanced MR signal in the pancreas (normalized to liver signal) after saline and glucose infusions is plotted vs. time after MnCl2 injection. Arrows denote time of injection for saline/glucose, and MnCl2 was injected at time = 0 min. A: high-dose STZ mice. B: low-dose STZ mice. Data points represent means ± SE of 5 high-dose STZ mice and 4 low-dose STZ mice. (Reprinted from Antkowiak, PF et al. Am J Physiol Metab 2009; 296: E573-578.)


![Photoinduced Magnetization in RbCo[Fe(CN)6]](http://s3.studylib.net/store/data/005886955_1-3379688f2eabadadc881fdb997e719b1-300x300.png)
