The Perfect Biology Lab Report - Signatur…
advertisement
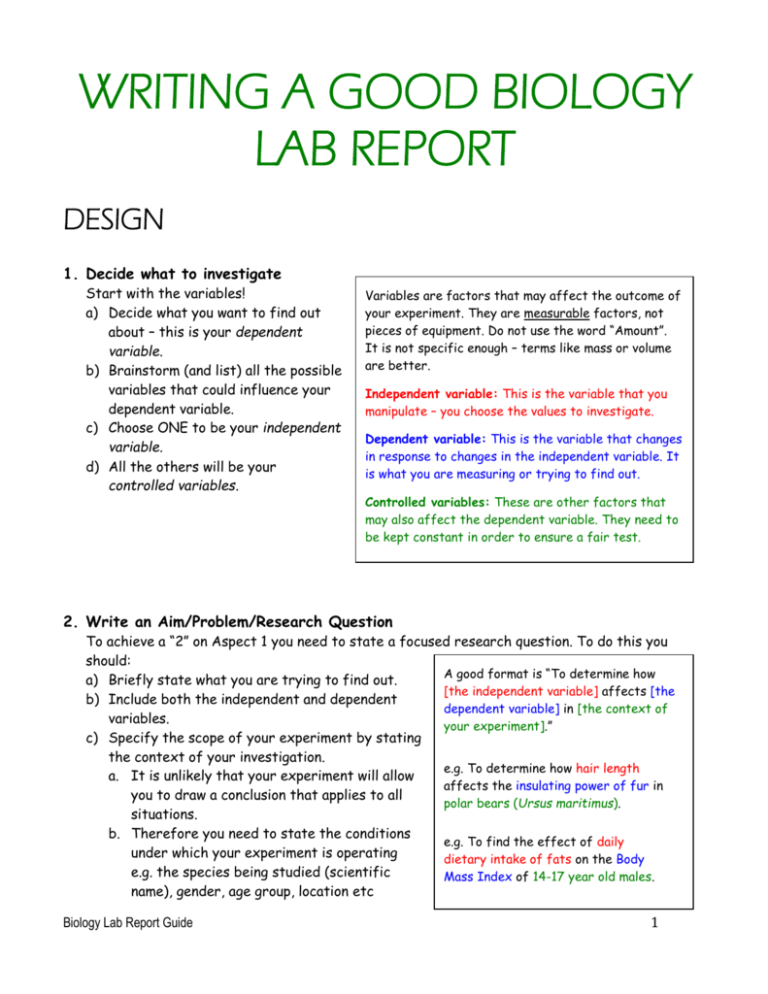
WRITING A GOOD BIOLOGY LAB REPORT DESIGN 1. Decide what to investigate Start with the variables! a) Decide what you want to find out about – this is your dependent variable. b) Brainstorm (and list) all the possible variables that could influence your dependent variable. c) Choose ONE to be your independent variable. d) All the others will be your controlled variables. Variables are factors that may affect the outcome of your experiment. They are measurable factors, not pieces of equipment. Do not use the word “Amount”. It is not specific enough – terms like mass or volume are better. Independent variable: This is the variable that you manipulate – you choose the values to investigate. Dependent variable: This is the variable that changes in response to changes in the independent variable. It is what you are measuring or trying to find out. Controlled variables: These are other factors that may also affect the dependent variable. They need to be kept constant in order to ensure a fair test. 2. Write an Aim/Problem/Research Question To achieve a “2” on Aspect 1 you need to state a focused research question. To do this you should: A good format is “To determine how a) Briefly state what you are trying to find out. [the independent variable] affects [the b) Include both the independent and dependent dependent variable] in [the context of variables. your experiment].” c) Specify the scope of your experiment by stating the context of your investigation. e.g. To determine how hair length a. It is unlikely that your experiment will allow affects the insulating power of fur in you to draw a conclusion that applies to all polar bears (Ursus maritimus). situations. b. Therefore you need to state the conditions e.g. To find the effect of daily under which your experiment is operating dietary intake of fats on the Body e.g. the species being studied (scientific Mass Index of 14-17 year old males. name), gender, age group, location etc Biology Lab Report Guide 1 3. Identify the variables Make sure you have read the information on variables (textbox in Step 1). In order to achieve a “2” for Aspect 1 you must: a) State the independent. b) State the levels of the independent variable Example for Step 3f. that will be tested (see step 5a for more Controlled Method to control the information). variable variable c) State the dependent variable. Temperature The test tubes in which d) State how the dependent variable will be at which the reaction occurs will measured (if it can’t be measured directly). reaction be placed in a water bath e) List several controlled variables. occurs set to 40C for the duration of the reaction. Aspect 2 requires that you explain the method Duration The reaction will be you will use to control each of the (controlled) (time) of the allowed to proceed for variables. reaction 300 seconds. This will be f) Give brief (but specific) explanation of how timed using a stopwatch (0.1seconds). you will control (keep at a constant value) each variable. Including this in the variables section ensures that you have considered each of the controlled variables. However, it should ultimately appear in the method. g) If a variable cannot be controlled, state this. Then describe how you will try to minimize any change and/or how you will monitor the variable. See Appendix 1 for uncertainties to consider. 4. List the equipment (apparatus and materials) needed Choosing appropriate equipment will allow you to achieve a “2” for Aspect 2. Make sure that your equipment list includes all of the following: a) All of the equipment and materials needed for the experiment (after writing you method read through it and check of the items used as you go on your equipment list) b) Numbers of items (e.g. 2 scalpels) c) Volumes and concentrations of any solutions needed (e.g. 300ml of 0.5M hydrochloric acid) d) Precision (and range if appropriate) of all measuring instruments. See Appendix 1(e). e) Sizes of beakers or other items (e.g. 250ml beaker, 10cm length of dialysis tubing) 5. Plan and write a method/procedure Planning a Method Aspect 3 of Design assesses your ability to collect sufficient relevant data. The following considerations are important to ensure that you collect enough data and that the data will help to answer your AimBiology Lab Report Guide Number of Values If you are looking for a correlation, at least 5 different values are needed (the more the better). If you are comparing two different situations, 2 values will 2 be sufficient. a) What values of the independent variable should you test? i. How many values should you test? Decide how many values will be needed to show any trend or pattern. Plan for an ideal situation – worry about time constraints later. ii.What is an appropriate range of values? Range of Values You may need to do some research to help you decide. e.g. if testing an enzyme that works in the human body then you would want to test values around 37C. If you are investigating similar enzymes in bacteria that live in hot springs it would be more appropriate to test around 80C. b) How will you measure your independent and dependent variables? a. Can you measure it directly (raw data) or do you need measure other values (raw data) and use them to calculate values (processed data) for your independent variable? b. What measuring instruments will be best to use? Do you know how to use them? Number of Trials c. What level of precision is required in your Biological systems, because of measurements? their complexity and normal variability, require replicate d. What units will you use to record your observations and multiple measurements? c) How may trials or replicates need to be carried out? a. Consider how you are going to process your data b. Now go back and double check that you have collected enough of the right types of measurements. Plan for an ideal situation – worry about time constraints later. samples of material. Remember that a minimum of 5 values is needed for calculating means and standard deviations. Other statistical tests have other requirements e.g. the t-test requires at least 10 values. See Appendix 1(g) for more info on replicates and sample size. Write the Procedure A clear, easy to follow method is necessary to achieve a “2” on Aspects 2 and 3. Think about method you have seen and what information you like to have! Someone (who has not done the experiment before) should be able to follow your procedure and obtain similar results. The following features contribute to writing a good method. d) The method can be written as instructions like a recipe e) Do not begin with “Gather all of the materials” … it is kind of a given that you will do this!! f) Use numbered steps (rather than paragraphs). g) Use a diagram if possible to show how to set up any equipment. Then you can say “Set up the equipment as shown in the diagram”. This would save you writing a lot of words. h) Specify what will be measured (and the units to be used) i) Include details of how you will measure values Biology Lab Report Guide 3 DATA COLLECTION AND PROCESSING RAW DATA refers to the values obtained from the measuring instruments exactly as they were shown. Once you to any addition, subtraction, multiplication or division then it becomes PROCESSED DATA. 1. Record you raw data The recording of raw data is necessary to address Aspect 1. If the data you record is not RAW data Quantitative data – numerical values obtained you will receive a “0” for this section. Raw data should include quantitative (always!) and qualitative (usually appropriate) data. Raw data should be displayed in a table (qualitative data may require some other format, but a table is till usually best). In constructing a data table you should consider the following features: from the measuring instruments (e.g. temperature, mass etc) or by other means e.g. counting Qualitative data – non-numerical observations. Other observations made during your experiment that may have a bearing on the conclusion or help to explain patterns and trends (or the lack of!). Examples include changes in colour, texture, size etc Any other observed sources of error should also be recorded. a) Structure a. When possible, the independent variable should come first in your columns followed by the dependent variable. b. Show lines around all rows and columns c. Make it clear. A good table should be able to be understood out of context (i.e. not embedded in a lab report describing the experiment) b) Title a. Title should be descriptive of the data contained in the table. It should include the key variables as well as any specific conditions of the experiment b. Should be numbered consecutively throughout the report with a specific identifying title. EXAMPLE Table 1: The relationship between temperature and water uptake in a leafy shoot of a geranium (Geranium carolinianum) c) Headings a. Columns should be clearly annotated with a heading, units (in heading not body), and an indication of uncertainty b. Headings should indicate what the data is in the column below c. Headings are likely to be the name of a variable Biology Lab Report Guide 4 d) Units a. Units should be included with a heading (not next to each data value in the table) e) Uncertainties a. All measurements have uncertainties and you must indicate them in your data tables. Uncertainties should be associated with all raw data and an attempt should always be made to quantify uncertainties. In IB Biology the instrument limit of error is usually taken to be equal to HALF the smallest unit of measurement. Plus or minus () this value is what you should record as your uncertainty. b. Remember that only measurements obtained with a measuring instrument have uncertainties. e.g. Counts do not have an uncertainty c. Uncertainties should appear with the units in the column heading For the degrees of precision, the simplest rule is that the degree of precision is plus or minus (±) the smallest division on the instrument (the least count). This is true for rulers and instruments with digital displays. The instrument limit of error is usually no greater than the least count and is often a fraction of the least count value. For example, a burette or a mercury thermometer is often read to half of the least count division. This would mean that a burette value of 34.1 cm3 becomes 34.10 cm3 (± 0.05 cm3). Note that the volume value is now cited to one extra decimal place so as to be consistent with the uncertainty. The estimated uncertainty takes into account the concepts of least count and instrument limit of error, but also, where relevant, higher levels of uncertainty as indicated by an instrument manufacturer, or qualitative considerations such as parallax problems in reading a thermometer scale, reaction time in starting and stopping a timer, or random fluctuation in an electronic balance read-out. Students should do their best to quantify these observations into the estimated uncertainty. f) Precision of data a. There is no variation in the precision of raw data; the same number of decimal places (significant figures) should be used. g) Anomalous results – any results that are particularly different from the others need to be excluded from any processing. Further advice on drawing data tables can be found at: http://www.saburchill.com/IBbiology/sci_invest/006.html Biology Lab Report Guide 5 2. Process your data Data processing involves combining and manipulating raw data to determine the value of a physical quantity (adding, subtracting, squaring, dividing), and taking the average of several measurements and transforming the data into a form suitable for the graphical representation. Simply plotting raw data is not considered processing. If the raw data is already in a form suitable for graphical presentation, it is not considered processing unless a line of best fit/trend line is drawn. See section 3d for details on lines of best fit. a) Look at Your Aim ALWAYS CONSIDER YOUR AIM. The purpose of processing data is to show patterns in the data that help you draw a conclusion that answers your Aim (not to pad out a lab report!). Aspect 2 requires that any processing helps in answering the Aim. b) Choose Your Processing Technique In Aspect 2 you will be assessed on your ability to choose appropriate processing techniques (types of calculations) and to carry out those calculations correctly. Some appropriate options for data processing in biology are: i. Change in quantities (initial final) o This is a very basic processing technique and should be used in combination with other methods. Change in quantities Final Initial ii. Percentage change in quantities. o This also allows you to compare quantities that have different initial and final quantities Percentage change in o This often more appropriate than change in quantity quantities as it helps to eliminate some of the error. Final Initial 100 o For example, since it is almost impossible to obtain Initial slices of potato that are the same dimensions, same consistency throughout, and the same mass to the degree of precision that your instruments allow, it is more appropriate to do a percentage change in quantity rather than simplechange in quantity calculations. iii. Rate o Rate is a measure of how quickly a variable changes Biology Lab Report Guide Rate Final Initial TimeTaken 6 iv. Mean and Standard Deviation o Whenever you have multiple trials in an experiment, it is good practice to calculate the mean and standard deviation. o Using the mean as opposed to individual values helps to minimize the error in your experiment. o Standard deviation also helps to indicate the spread of your values around the mean. A smaller standard deviation indicates that the values are clustered closely around the mean (and therefore possibly more reliable); a larger standard deviation indicates a wider spread (values are possibly less reliable). v. t-test o Deduce the significance of any difference between two sets of data using calculated values for t and the appropriate tables. Your sample size should be at least 10. Remember that the t-test shows that two sets of data are significantly different (possibly due to your independent variable) if the p-value is 0.05 o Always include degrees of freedom in your write-up. o Usually used with continuous data. o See your notes for details on how to perform a t-test. vi. Chi-Squared Analysis o Used to determine correlation between the observed and expected. Common analysis used in genetics when analyzing traits for linkage. o usually used with discrete data (e.g. genotype, colour) vii. Percentage error Percentage error o This is used when comparing your TheoreticalValue ActualValue actual measurements to a 100 TheoreticalValue theoretical measurement. Percentage error describes the accuracy of measurements. You should always use percentage calculations as opposed to the numerical difference. This is because 10 cm error means nothing if you are measuring the distance between Shanghai and Beijing, but it is a huge error if you are measuring the length of a piece of paper. viii. Percentage deviation o A measure of precision when a theoretical value is not known. This informs how reproducible your experiment is. Percentage deviation AverageDeviation 100 Mean ix. Correlation Coefficient o This can tell you the strength of a relationship between 2 variables. o Can be determined in Excel once you have plotted a trend line using the CORREL formula (see your Statistical Analysis booklet for a more detailed description). Biology Lab Report Guide 7 c) Carry out your Calculations Make sure you go back and double-check your calculations. See section 3a to make sure that you have presented you work correctly d) Treatment of Uncertainties i) The uncertainties associated with the raw data must be taken into account. ii) It is possible (although not necessary for IB Biology) to calculate numerical uncertainties for processed data values. If you are adding measured volumes each with an uncertainty of 0.05, then you should add the uncertainties. iii) Mean and SD are acceptable ways of showing this in graphs with error bars. The mean should be the plotted point or height of the bar. For each point an error bar can be drawn that extends above the point/bar 1 SD and below the point/bar 1 SD. The size of the error bar is also an indication of the reliability of you data (and therefore any conclusion you draw from it) iv) The treatment of uncertainties in graphical analysis (scatter plots) requires the construction of appropriate best-fit lines. Further information on processing techniques (when and how to use them) can be found at: http://www.saburchill.com/IBbiology/stats/stats_hp.html http://moodle.wab.edu/mod/resource/view.php?id=3273 3. Present your processed data You are expected to decide upon a suitable presentation format without teacher assistance. Your ability to show how you processed the data, choose the correct presentation method and construct graphs etc will determine your level of achievement for Aspect 3. Important things to consider:a) Present data so that stages to final results can be followed This will often mean showing your working for each type of calculation done (not for every single calculation done!). Each worked example should include the following: i) Heading describing the calculation ii) Formula iii) Identification of which set of data is being used in that example iv) Fully worked example v) If Excel or a graphing calculator was used to generate values (i.e. you didn’t have to plug numbers into an equation) it is OK to simply state this. In the case of Excel you should state the formula used. vi) Flowcharts may also be appropriate here b) Significant Figures i) Inclusion of metric/SI units is expected for final derived quantities, which should be expressed to the correct number of significant figures. Your processed data should not have more significant figures (or decimal places) that the raw data you collected Biology Lab Report Guide 8 ii) All processed data should be to the same number of significant figures c) Treatment of Uncertainties The uncertainties associated with the raw data must be taken into account. i. It is possible (although not necessary for IB Biology) to calculate numerical uncertainties for processed data values. If you are adding measured volumes each with an uncertainty of 0.05, then you should add the uncertainties. ii. Mean and SD are acceptable ways of showing this in graphs with error bars. The mean should be the plotted point or height of the bar. For each point an error bar can be drawn that extends above the point/bar 1 SD and below the point/bar 1 SD. The size of the error bar is also an indication of the reliability of you data (and therefore any conclusion you draw from it) iii. The treatment of uncertainties in graphical analysis (scatter plots) requires the construction of appropriate best-fit lines. Biology Lab Report Guide 9 d) Presentation formats A few general options are listed below; however, understand that you are not limited to these options as there are many processing options specific to certain labs such as electrophoresis gel analysis, and logarithmic graphs: i. Spreadsheets and tables showing data calculations such as mean, SD, percentage change etc. ii. Line graphs and scatter-plots showing continuous data points (e.g. time, concentration, age, heart rate, height etc.) with line of best fit iii. Bar graphs showing discrete data (categories) e.g. species, phenotype, sex, ethnicity iv. Pie charts showing percentages out of 100% v. Biological diagrams to illustrate changes in appearance (should be used in combination with other methods) Diagrams and Tables vi. There should be clear, unambiguous headings for diagrams and tables or graphs similar to the heading used for tables in your data collection. vii. Diagrams will be labelled as figures. Figures should be numbered for reference and be placed below the figure it references. Graphs viii. Think about why you are drawing your graph …. It should be a visual representation of the data hat allows you to answer the Aim. Therefore it should look like Dependent variable/ units Independent variable/ units ix. Graphs can be drawn by hand or using graphing software such as Excel (as long as you have had to make the decisions on the format, axes, scale etc). However, an inability to manipulate the program to show the necessary elements is not an excuse for failing to include them! x. Graphs must have the following: Title. The same expectations apply as for table (see section on Recording Raw Data). Graphs will be labelled as figures. Figures should be numbered for reference and be placed below the figure it references. Appropriate scales; if you are measuring temperatures between 30 and 40 degrees, your graph should not begin and end at 0 and 100 respectively. Your units must be appropriate as well. If you Biology Lab Report Guide 10 are measuring in mm, you shouldn’t have meters marked on your graph. Think of a graph like a microscope; you want to see as much detail as possible. Labeled axes with units; axes should be labeled similarly to your table headings. Accurately plotted data points should be clearly shown A suitable best-fit line, trend line or curve is drawn (for a line graph or scatter plot) DO NOT CONNECT THE DOTS A one-sentence explanation as to what the particular processing method shows would not hurt. In some cases it would be a good idea to include a concluding statement about the results, though you should deal with its significance in your lab in your conclusion. Example A Chi-squared analysis was done to determine if the differences between the observed data and the expected data are significant. The p-value was between .05 and .025 at 3 degrees of freedom, showing that the differences were significant. Further information on graphing can be found at: http://www.saburchill.com/IBbiology/graphs/001.html Biology Lab Report Guide 11 CONCUSION AND EVALUATION Accuracy = how close a measurement is to the correct value Precision = exactness of a measurement as represented by the number of decimal places to which it is expressed Reliability = consistency in measurements (i.e. if measurements taken over consecutive trials are all very similar then there is consistency and they are said t be reliable). This can be shown by the standard deviation. 1. Write a Conclusion Your conclusion is what is assessed for Aspect 1. This section should be one or more paragraphs in which you draw conclusions from your results, and reflect on whether or not they are reliable/trustworthy. To achieve at the highest level for this aspect you should make sure that: a) Conclusions are truthful and based on the data. Don’t try and twist your results to fit a hypothesis or expected outcome. b) The conclusion is clearly related to the Aim. c) The conclusion provides a thorough description of any trends or patterns Bad example The results show that the concentration of sugar affects the rate of respiration. As the sugar concentration increased so did the rate of respiration. GOOD example We can conclude that there is a positive, linear relationship between the concentration of sugar and the rate of respiration. The correlation coefficient of 0.9 indicates that it is a strong relationship. d) Use your results to justify your conclusion (explain how your results support your conclusion). See example to the right e) Try to explain your results, observations, trends, and patterns revealed by the data using Biology theory. This may come from i. your own knowledge from class ii. literature research – e.g. textbook, journal articles etc Biology Lab Report Guide The trend line in Figure 1 shows that there is a positive, linear relationship between the concentration of sugar and the rate of respiration. The correlation coefficient of 0.9 indicates that it is a strong relationship. 12 f) Express your confidence in your results i. When measuring an already known and accepted a) value of a physical quantity, or b) a trend/relationship between two variables you should compare your experimental value with a textbook/literature value. ii. If you are comparing an experimental value using percentage error can be useful to determine how close they were iii. Standard deviations and error bars can also indicate your confidence in your results. E.g. Large S.D.’s / error bars suggest great variability in your data, making it less reliable. g) All literature used to write you lab report should be fully referenced by using MLA formatting to produce: i. Bibliography- Help on how to produce a bibliography can be found at http://owl.english.purdue.edu/owl/resource/747/07/ ii. In-text referencing- advice on the correct format can be found at http://owl.english.purdue.edu/owl/resource/747/02/ 2. Discuss weaknesses in your investigation Aspects 2 and 3 require you to evaluate the procedure. Aspect 2 deals with weaknesses Good format for Evaluation in the procedure and their impact on the Weakness Significance Improvement results. This is where you comment on the design, method of the investigation, and the quality of the data. A good format for the Evaluation is shown to the right. In order to achieve a 2 on Aspect 2 you should: a) List specific weaknesses in the design of the procedure. You could look at i. Processes ii. Techniques iii. Choice of equipment e.g. type of equipment, its precision, its accuracy iv. Number of trials v. Other possible sources of error that were not addressed b) List specific weaknesses in carrying out the procedure. You could look at i. Use of equipment ii. Management of time iii. Human errors iv. Other possible sources of error that were not addressed Biology Lab Report Guide 13 c) For each weakness discuss its significance. This includes: i. How the weakness affected your results e.g. values too high/low, data values less reliable (large uncertainty/error/S.D. would indicate this), measurements less accurate or precise, trend/pattern incorrect or unclear etc ii. By how much your results were affected i. e.g. if a weakness was significant it would have had a large effect on your results ii. if uncertainties are smaller than those expected due to natural variability (background noise) in the biological system then they are unlikely to be significant d) Ensure that you have addressed the quality of your data (e.g. precision and accuracy of measurements) Acceptable Example: “Because the simple calorimeter we used was made from a tin can, some heat was lost to the surroundings—metals conduct heat well. Therefore, the value we obtained for the heat gained by the water in the calorimeter was lower than it should have been. The heat lost from the tin can would not have been a lot in the time taken for the experiment so this probably did not have a significant impact on the results” Unacceptable Examples: "The test tubes weren’t clean.” careless or poor performance does not make for a valid weakness “Human error.” a specific description of the type of human error would be required 3. Describe improvements for each identified weakness This section deals with Aspect 3. Suggestions for improvements should be based on the weaknesses and limitations identified in Aspect 2. For each improvement ensure that: a) Modifications are specific (numerical if possible). “Next time we should work more carefully” is not acceptable. b) Modifications are realistic – they can be achieved within the constraints of the timetable, school setting and budget. c) Improvements are not overly simplistic or superficial – you need to demonstrate that you are a science student at a Diploma level! Biology Lab Report Guide 14 Appendix 1 Terms and concepts in error analysis (adapted from IBO’s Online Curriculum Centre) (a) Random variation or normal variation i) In biological investigations, errors can be caused by a. changes in the material used, or b. by changes in the conditions under which the experiment is carried out. c. e.g. the osmotic potential of potato tissue will vary between different potatoes. Different parts of the same potato will also show variations, but they will probably show a normal variation that is less than that from samples taken from different potatoes. ii) Random errors can, therefore, be kept to a minimum by careful selection of material and by careful control of variables. a. e.g. you could use a water bath to reduce the random fluctuations in ambient temperature. (b) Human errors (mistakes) i) Human errors can occur when tools, instruments or protocols are used or read incorrectly. a. e.g. A temperature reading from a thermometer in a liquid should be taken after stirring the liquid and with the bulb of the thermometer still in the liquid. b. e.g. Thermometers (and other instruments) should be read with the eye level with the liquid in the thermometer (reading needle) to prevent parallax error. ii) Human errors can be systematic, because the experimenter does not know how to use the apparatus properly, or iii) They can be random, because the power of concentration of the experimenter is fading. To help overcome this: a. Automated measuring, using a data logger system, can be used b. Alternatively, the experimenter can take a break occasionally. (c) The act of measuring i) When a measurement is taken, this can affect the environment of the experiment. a. E.g. when a cold thermometer is put into a test tube with only a small volume of warm water in it, the water will be cooled by the presence of the thermometer, or b. E.g. when the behaviour of animals is being recorded, the presence of the experimenter may influence the animals’ behaviour. (d) Systematic errors a) Systematic errors can be reduced if equipment is regularly checked or calibrated to ensure that it is functioning correctly. a. e.g. a thermometer should be placed in an electronic water bath to check that the thermostat of the water bath is correctly adjusted. b. e.g. a blank should be used to calibrate a colorimeter to compensate for the drift of the instrument. (e) Degrees of precision and uncertainty in data i) You must choose an appropriate instrument for measuring such things as length, volume, pH and light intensity. You don’t need to justify every piece of equipment (in a normal science lab the most appropriate instrument may not be available). Biology Lab Report Guide 15 ii) For the degrees of precision, the simplest rule is that the degree of precision is plus or minus (±) the smallest division on the instrument (the least count). This is true for rulers and instruments with digital displays. iii) The instrument limit of error is usually no greater than the least count and is often a fraction of the least count value. a. e.g. a burette or a mercury thermometer is often read to half of the least count division. This would mean that a burette value of 34.1 cm3 becomes 34.10 cm3 (± 0.05 cm3). Note that the volume value is now cited to one extra decimal place so as to be consistent with the uncertainty. (g) Replicates and samples i) Biological systems, because of their complexity and normal variability, require replicate observations and multiple samples of material. As a rule, a. the lower limit is five measurements, or a sample size of five. b. Very small samples run from 5 to 20, c. small samples run from 20 to 30, and d. big samples run from 30 upwards. ii) Obviously, this will vary within the limits of the time available for an investigation. It is also possible to use class data to generate sufficient replicates to permit adequate processing of the data. However, you must have been personally involved in the data collecting process, and your own set of raw data should be presented and clearly identified. iii) Where sufficient replicates have been carried out, then the calculation of the standard deviation of the mean is expected. Another statistic, the standard error of the mean to derive confidence limits, may also be calculated. The standard error is not expected, but it would be an acceptable alternative to the standard deviation. Biology Lab Report Guide 16
