Appendices B-G - Proceedings of the Royal Society B
advertisement
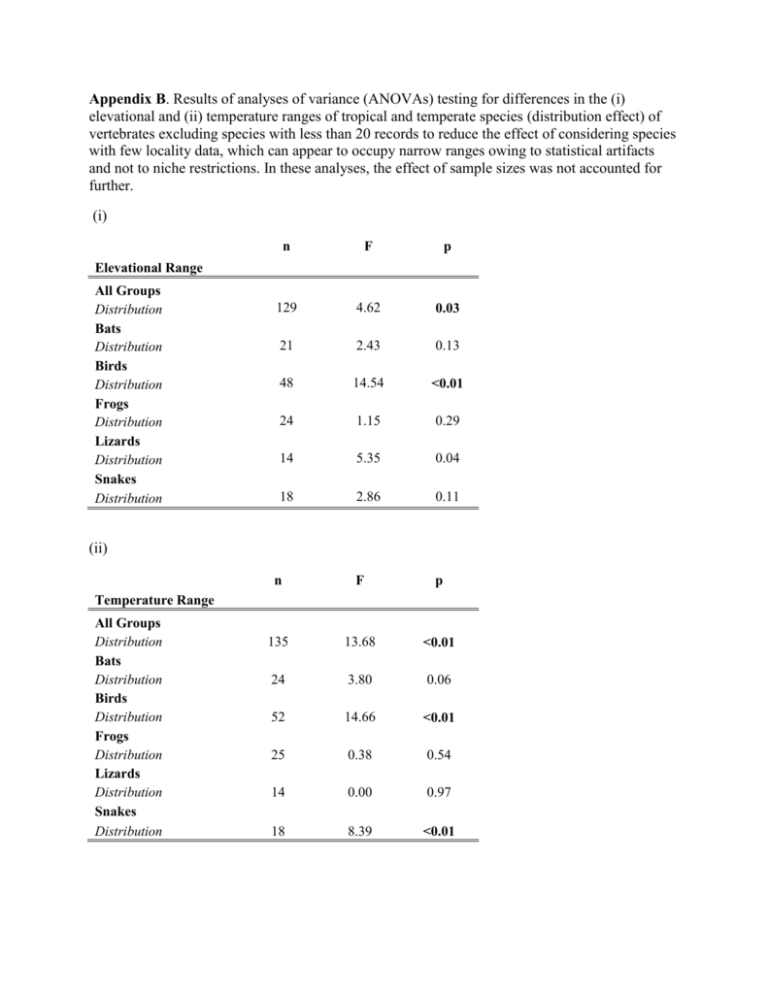
Appendix B. Results of analyses of variance (ANOVAs) testing for differences in the (i) elevational and (ii) temperature ranges of tropical and temperate species (distribution effect) of vertebrates excluding species with less than 20 records to reduce the effect of considering species with few locality data, which can appear to occupy narrow ranges owing to statistical artifacts and not to niche restrictions. In these analyses, the effect of sample sizes was not accounted for further. (i) n F p 129 4.62 0.03 21 2.43 0.13 48 14.54 <0.01 24 1.15 0.29 14 5.35 0.04 18 2.86 0.11 n F p 135 13.68 <0.01 24 3.80 0.06 52 14.66 <0.01 25 0.38 0.54 14 0.00 0.97 18 8.39 <0.01 Elevational Range All Groups Distribution Bats Distribution Birds Distribution Frogs Distribution Lizards Distribution Snakes Distribution (ii) Temperature Range All Groups Distribution Bats Distribution Birds Distribution Frogs Distribution Lizards Distribution Snakes Distribution Appendix C. Results of analyses of covariance (ANCOVAs) testing for differences in the (i) elevational and (ii) temperature ranges of tropical and temperate species of vertebrates (distribution effect) excluding species with less than 20 records and including the number of localities as a covariate. In these analyses, the effect of sample sizes was taken into consideration explicitly by removing species with few data and then correcting for the effect of sample sizes including this covariate (localities effect). (i) n F p 129 129 5.02 4.77 0.02 0.03 21 21 0.19 2.33 0.66 0.14 48 48 1.03 14.55 0.31 <0.01 24 24 6.35 1.43 0.01 0.24 14 14 2.49 6.02 0.14 0.03 18 18 17.18 5.43 <0.01 0.03 Elevational Range All Groups Localities Distribution Bats Localities Distribution Birds Localities Distribution Frogs Localities Distribution Lizards Localities Distribution Snakes Localities Distribution (ii) n F p 135 135 31.95 16.86 <0.01 <0.01 24 24 4.47 4.40 0.04 0.04 52 52 11.27 17.68 <0.01 <0.01 25 25 14.96 0.61 <0.01 0.44 14 14 11.68 0.00 <0.01 0.95 18 18 8.12 11.71 0.01 <0.01 Temperature Range All Groups Localities Distribution Bats Localities Distribution Birds Localities Distribution Frogs Localities Distribution Lizards Localities Distribution Snakes Localities Distribution Appendix D. Elevational and temperature ranges occupied by temperate and tropical species in five vertebrate groups. Sample sizes are number of species. In contrast to the figure portrayed in the main text, which used as response variable the residuals of the regression used to correct for the number of localities, this figure shows the raw data of elevational and temperature ranges. Boxplots indicate median, lower and upper quantiles, the 5% and 95% percentiles, and outliers. Asterisks indicate significant differences based on the ANOVA shown in Appendix B. Patterns are similar to those of analyses described in the main text. 5000 All Groups n = 129 Bats n = 21 Birds n = 48 * Frogs n = 24 Lizards n = 14 Snakes n = 18 Lizards n = 14 Snakes n = 18 * Elevational Range 2000 Elevational Range 3000 Elevational Range Elevational Range 4000 1000 0 All Groups n = 135 Bats n = 24 Birds n = 52 * Frogs n = 25 * * Temperature Range 40 30 20 10 0 Tropical Temperate Tropical Temperate Tropical Temperate Tropical Temperate Tropical Temperate Tropical Temperate Appendix E. Full results of analyses of covariance (ANCOVAs) testing for differences in the (i) elevational and (ii) temperature overlap of sister species of vertebrates between the tropical and temperate zones (distribution effect). Results related to the tropical vs. temperate comparisons were reported in the main text, but those related to the effect of genetic distance (surrogate for divergence time) and number of localities were not reported for brevity and because they were not significant and were included in analyses only as possibly confounding variables. (i) Elevational Overlap All Groups Genetic Distance Localities Distribution Bats Genetic Distance Localities Distribution Birds Genetic Distance Localities Distribution Frogs Genetic Distance Localities Distribution Lizards Genetic Distance Localities Distribution Snakes Genetic Distance Localities Distribution n F p 93 93 93 0.21 3.76 0.58 0.65 0.06 0.45 15 15 15 0.00 0.32 3.47 0.97 0.59 0.04 30 30 30 8.39 1.84 0.73 0.01 0.19 0.40 20 20 20 0.23 2.27 0.71 0.64 0.15 0.41 14 14 14 0.00 0.36 0.48 0.99 0.56 0.50 14 14 14 0.09 0.01 0.74 0.77 0.92 0.41 (ii) Temperature Overlap All Groups Genetic Distance Localities Distribution Bats Genetic Distance Localities Distribution Birds Genetic Distance Localities Distribution Frogs Genetic Distance Localities Distribution Lizards Genetic Distance Localities Distribution Snakes Genetic Distance Localities Distribution n F p 93 93 93 0.58 1.15 10.42 0.45 0.29 0.00 15 15 15 0.58 1.73 0.03 0.46 0.22 0.88 30 30 30 0.72 1.15 6.23 0.40 0.29 0.02 20 20 20 0.00 0.02 0.19 0.98 0.89 0.67 14 14 14 0.26 4.06 7.86 0.62 0.07 0.02 14 14 14 0.16 0.08 1.42 0.70 0.79 0.26 Appendix F. Full results of analyses of covariance (ANCOVAs) testing for differences in the (i) elevational and (ii) temperature overlap of sister species of vertebrates between the tropical and temperate zones computed using approaches different from those described in the main text. Here, elevational overlap was calculated using the formula proposed by Kozak and Wiens to calculate thermal overlap (reference 17 in the main text), whereas thermal overlap was calculated using the formula used by Janzen (9). The formulae to calculate overlap are shown in the tables, where OAB is the overlap between sister species A and B, RA is the range (in meters or degrees Celsius) of species A, and RB is the range of species B. (i) n F p 93 93 93 3.17 4.06 0.00 0.12 0.04 0.94 15 15 15 0.44 0.27 0.01 0.51 0.61 0.91 30 30 30 4.20 0.96 0.08 0.77 0.33 0.77 20 20 20 0.35 2.15 0.00 0.55 0.16 0.93 14 14 14 0.13 1.70 0.03 0.71 0.21 0.86 14 14 14 0.25 0.03 0.00 0.62 0.86 0.96 Elevational Overlap All Groups Genetic Distance Localities Distribution Bats Genetic Distance Localities Distribution Birds Genetic Distance Localities Distribution Frogs Genetic Distance Localities Distribution Lizards Genetic Distance Localities Distribution Snakes Genetic Distance Localities Distribution Calculated as 0.5(OAB/RA+OAB/RB) (ii) n F p 93 93 93 0.59 0.29 9.69 0.44 0.58 0.00 15 15 15 0.60 1.78 0.12 0.43 0.20 0.73 30 30 30 0.38 2.11 6.10 0.53 0.15 0.02 20 20 20 0.00 0.02 0.44 0.98 0.87 0.51 14 14 14 0.01 4.19 3.90 0.91 0.06 0.07 14 14 14 0.09 0.06 2.73 0.75 0.79 0.12 Temperature Overlap All Groups Genetic Distance Localities Distribution Bats Genetic Distance Localities Distribution Birds Genetic Distance Localities Distribution Frogs Genetic Distance Localities Distribution Lizards Genetic Distance Localities Distribution Snakes Genetic Distance Localities Distribution Calculated as OAB/√(RA*RB) Appendix G. Overlap in elevational range and temperature regime of temperate and tropical species in five vertebrate groups. Sample sizes are number of species. Here, elevational and temperature overlap were calculated as described in Appendix F (i.e. using different formulae from those used in the main text). Boxplots indicate median, lower and upper quantiles, the 5% and 95% percentiles, and outliers. Asterisks indicate significant differences based on the ANCOVA shown in Appendix F. 1.2 All Groups n = 93 Bats n = 15 Birds n = 30 Frogs n = 20 Lizards n = 14 Snakes n = 14 Elevational Overlap 1.0 0.8 0.6 0.4 0.2 0.0 12 * * Temperature Overlap 10 8 6 4 2 0 Tropical Temperate Tropical Temperate Tropical Temperate Tropical Temperate Tropical Temperate Tropical Temperate


