BEQI tool guidelines
advertisement
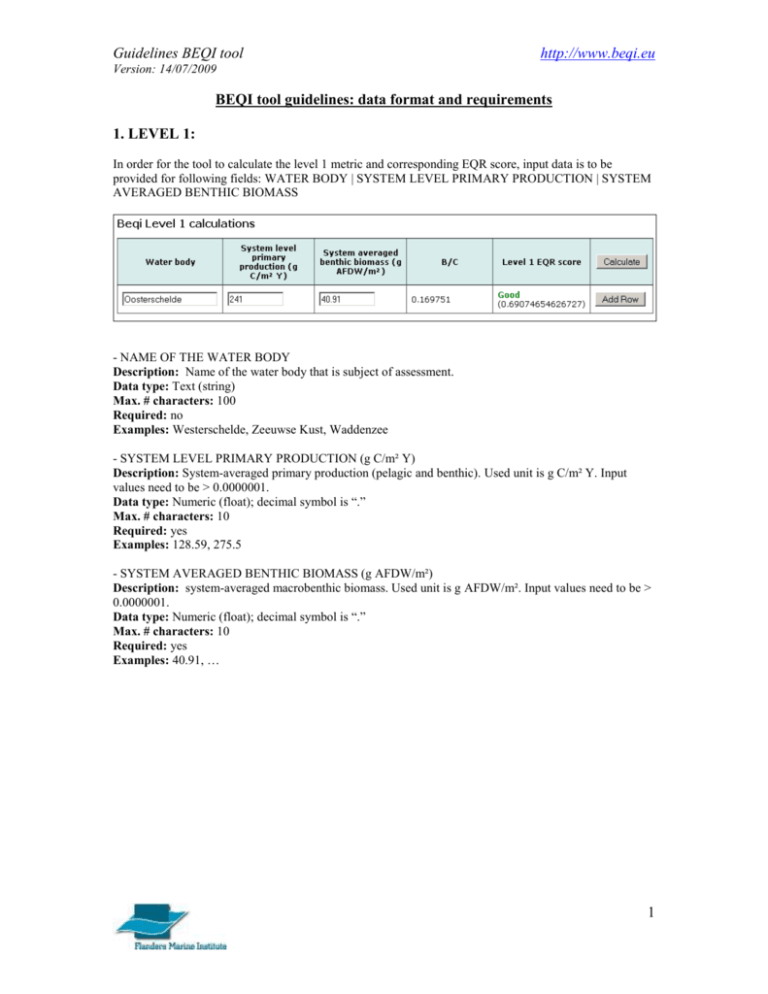
Guidelines BEQI tool http://www.beqi.eu Version: 14/07/2009 BEQI tool guidelines: data format and requirements 1. LEVEL 1: In order for the tool to calculate the level 1 metric and corresponding EQR score, input data is to be provided for following fields: WATER BODY | SYSTEM LEVEL PRIMARY PRODUCTION | SYSTEM AVERAGED BENTHIC BIOMASS - NAME OF THE WATER BODY Description: Name of the water body that is subject of assessment. Data type: Text (string) Max. # characters: 100 Required: no Examples: Westerschelde, Zeeuwse Kust, Waddenzee - SYSTEM LEVEL PRIMARY PRODUCTION (g C/m² Y) Description: System-averaged primary production (pelagic and benthic). Used unit is g C/m² Y. Input values need to be > 0.0000001. Data type: Numeric (float); decimal symbol is “.” Max. # characters: 10 Required: yes Examples: 128.59, 275.5 - SYSTEM AVERAGED BENTHIC BIOMASS (g AFDW/m²) Description: system-averaged macrobenthic biomass. Used unit is g AFDW/m². Input values need to be > 0.0000001. Data type: Numeric (float); decimal symbol is “.” Max. # characters: 10 Required: yes Examples: 40.91, … 1 Guidelines BEQI tool http://www.beqi.eu Version: 14/07/2009 2. LEVEL 2: In order for the tool to calculate the level 2 metric and corresponding EQR score, input data is to be provided for following fields: LANDSCAPE | REFERENCE SURFACE | CURRENT SURFACE - LANDSCAPE Description: Name of landscape or habitat (ecotope) Data type: Text (string) Max. # characters: 100 Required: no Examples: Intertidal area, Mussel bank,… - REFERENCE SURFACE Description: Surface area considered reference condition for the assessed landscape or habitat. Usually expressed in m² or ha. Data type: Numeric (integer); decimal symbol “.” Max. # characters: 10 Required: yes Examples: 4200, 1370, … - CURRENT SURFACE Description: Currently existing surface area for the assessed landscape or habitat. Usually expressed in m² or ha. Unit should be the same as in “Reference surface”. Data type: Numeric (integer); decimal symbol “.” Max. # characters: 10 Required: yes Examples: 2327, 1211, …. 2 Guidelines BEQI tool http://www.beqi.eu Version: 14/07/2009 3. LEVEL 3: To calculate the BEQI level 3, this web tool uses the fortran programme that was developed by Peter Herman at the Netherlands Institute of Ecology. This program is available here for download. If you would desire to use the desktop tool, for example to be able to calculate the reference boundary distribution for your reference dataset for any given sampling surface, please contact us at VLIZ. We can assist you in the proper use of the tool In order for the web tool to calculate the level 3 metric, you need both reference and assessment data. Both are to be submitted in one and the same file. 3.1 Checks: A number of checks are performed on the submitted data. Part of the checks is performed immediately after submitting the input file and generates an immediate feedback in case of found errors. Another part of the checks is performed in the second step, while running the actual script. Found errors will not be fatal for the run but will lead to warnings in the output. Immediate checks: - A number of checks on the submitted data format and allowed data types for each column (for the required data format see section on data format below). A number of checks on normalization of the dataset: o Each station needs to be represented in the dataset by a unique sample number and needs to be part of one unique ecotope. The same sample number (ID) cannot be present in more then one ecotope and cannot be used in both reference and assessment dataset. o Each sample can only have one corresponding surface area. o Each species can be mentioned only once in each sample. No duplicate species within the samples are allowed. o Density and biomass cannot both be 0 for a certain sample. (Except for empty samples.) - Species need to be taxonomically valid. Spelling errors and the use of synonymous species names in your dataset will lead to multiple species giving a false impression of species richness of a station. - It is checked whether a biomass column is uploaded or not. Depending on the presence of biomass data in the input, the parameter will be taken up into the calculations and output. - It is checked whether the dataset has samples without biotic content. Empty samples should be reported by using ‘EMPTY SAMPLE’ in the sample column. The density and biomass columns should both have the zero value for that record. If empty samples are detected they are dealt with correctly. - For performance reasons, the maximum number of species, stations per ecotope, ecotopes are set to 500, 1250, 20 rows resp. Checks in the second step: - It is checked whether the variation in surface areas of the individual samples within each ecotope is not to high. If standard deviation is bigger then the mean a warning is given that there is no equal distribution. - It is checked whether the total surface of the reference sample and the assessment sample per ecotope reaches the needed minimum. 3 Guidelines BEQI tool http://www.beqi.eu Version: 14/07/2009 3.2 Data format: Data is to be provided to the tool using a text (.txt) or comma separated (.csv) file. Reference and assessment data are to be submitted in one and the same file. The data in the file is to be structured in 6 or 7 columns (depending on the presence of biomass data): ECOTOPE | SAMPLE | REF/ASS | AREA | SPECIES | DENSITY | BIOMASS. The column headers are not to be included in the file. - ECOTOPE Description: Name of ecotope or habitat. The ecotope or habitat can be defined based on physical parameters (e.g. salinity, depth, sedimentology, hydrodynamics) or biological parameters (e.g. ‘community concept’). Data type: Text (string) Max. # characters: Required: yes Examples: Marine littoral, Marine sub-littoral, … - SAMPLE: Description: Unique number that refers to a sample that is taken. The methodology does not require to pool the replicate samples at stations. Data type: Numeric (integer); decimal symbol is “.” Max. # characters: 10 Required: yes Examples: 1, 2, 3, 4, 5,…. - REF/ASS: Description: Defines for each row whether it is part of your reference dataset or your assessment dataset. Data type: Text (string) Max. # characters: 3 Required: yes Examples: Ref, Ass. - AREA: The surface area of your sample in m². Description: The surface area that was sampled at a certain station. Data type: Numeric (float); decimals symbol is “.” Max. # characters: 20 Required: yes Examples: 0.01, 0.012, 0.1 4 Guidelines BEQI tool http://www.beqi.eu Version: 14/07/2009 - SPECIES: Description: the name of the taxon that was found in the sample. Can be a true species, or can be an ‘ecological species’, meaning a genus, higher taxon or group that is considered as one ecological element in the analysis. Keep in mind that the used taxonomy has to be consistent over the entire uploaded dataset. (see data truncation rules 3.3) Data type: Text (string) Max. # characters: 100 Required: yes Examples: Aphelochaeta marioni, Crangon crangon, …. - DENSITY: Description: the density (number of species per m2) for a specific species Data type: Numeric (float); decimal symbol is “.” Max. # characters: 20 Required: yes Examples: 404.04, 19.37 - BIOMASS: Description: The AFDW of the macrozoobenthos in the sample per m2 Data type: Numeric (float) Max. # characters: 20 Required: no Examples: 235.6, 38.40 5 Guidelines BEQI tool http://www.beqi.eu Version: 14/07/2009 3.3 Data truncation rules (e.g. the Netherlands/Belgium): It is very important to standardize the taxonomy within the datasets, especially when data is derived from different projects or laboratories, before you calculate the results. Therefore, the various reasons for truncation of the data and the applied rules within the Dutch and Belgian context are summarized in this section. - Removal of non benthic invertebrate taxa (e.g. fish and algae) - Inconsistencies in identification level between laboratories and projects, or the impossibility to identify to a lower taxonomical level (broken animals, no adequate identification keys); this in particular can affect classification tools as it can give a false impression of species richness in a sample. Therefore, following rules are applied: Grouping to the highest taxonomical level present in the dataset. If some individuals within a certain taxonomical group are not identified to species level they are grouped to genus level (e.g. if Eteone sp., Eteone longa and Eteone flava are present in a dataset, they have to be grouped to Eteone). o Some exceptions to this rule: When the number of samples, in which the higher taxonomical level is found is lower than 2, that taxonomical level is excluded. The taxonomical inconsistence is conserved when the loss of detailed information would be too high (e.g. Nepthys, Nereis). - Removal of non-soft sediment taxa (hyper- and epibenthic taxa). This again has an impact on the richness of a sample. - New taxonomical developments can lead to a more accurate identification compared to `historical` datasets. Therefore, some species are grouped to a higher taxonomical level (e.g. the distinction between Magelona papilicornis, M. mirabilis, and M. johnstoni was not consistent throughout the years). - Some taxonomic groups have to be combined to the level specified to negate the problem of inconsistent levels of identification: Oligochaeta, Nemertea, Echiura, Sipuncula, Phoronida, Priapulida, Holothuroidea, Archiannelida. The application of these rules made the datasets for the reference and assessment analysis more consistent. The used taxa (species) per water body are summarized in the appendix under the section species lists, because differences in species truncation between the water bodies exist. 6 Guidelines BEQI tool http://www.beqi.eu Version: 14/07/2009 3.4 Output interpretation: In order to help the user with the interpretation of the output file, an exemplary output file is presented below. The output file includes explanation for each of the elements (inserted in blue). BEQI result generated 2009-07-14 09:14:57 Biomass was provided in the inputfile. This summarizing table gives per parameter the ecological status class and ecological quality ratio for each of the included ecotopes. ‘Final EQR default’ is the average score of the four parameters without weighing. ‘Final EQR NL’ is the average score of the four parameters with weighing (similarity half weighted compared to the rest). The Dutch Government for the ecological status classification of the transitional and coastal waters uses this score. Ecotope Similarity EQR No. of species EQR Density EQR Biomass EQR GOOD (0.626) HIGH (0.9) GOOD (0.61) MODERATE (0.556) ECOTOPE marine littoral[hdyn] Final EQR Default Final EQR NL 0.51-1-1 0.673 0.68 >> Download comma separated file (.csv) << Ecotope: ECOTOPE marine littoral[hdyn] Reference boundary values: Parameter EQR Ass Bad- Poor- Mod- Good- High Poor Mod Good High limit 0.2 0.4 0.6 0.8 1 High- Good- Mod- PoorGood Mod Poor Bad 0.8 0.6 0.4 0.2 Density GOOD (0.61) 4914.0 432.2 864.5 1296.8 2029.8 2525.4 3227.6 5007.4 6676.5 8345.6 Biomass MODERATE (0.556) 8.2 0.5 1.1 1.7 3.0 Similarity GOOD (0.626) 0.77 0.25 0.51 0.76 0.82 No. of species HIGH (0.9) 52 11.6 23.3 35.0 41.0 3.8 4.9 7.4 9.8 7 12.3 Guidelines BEQI tool http://www.beqi.eu Version: 14/07/2009 The above table lists the reference boundary values for each WFD boundary for each parameter for the ecotope marine littoral[hdyn]. WARNING! Surfaces of reference samples are very unequally distributed This may affect significance calculations adversely This warning message indicates that the sample surfaces of some samples within the reference dataset were differing a lot (the standard deviation is bigger than the average). This can have an effect on the analysis (e.g. number of species). Total surface of reference sample 6.01 Sum of the samples surfaces of 0.94 Sum of the samples surfaces of the samples in the reference dataset Total surface of assessment sample the samples in the assessment dataset SIMILARITY CALCULATIONS More detailed results of the analysis of the parameter similarity Power to detect changes is GOOD A power analysis is used to determine the level of confidence of the analysis. The possibility to detect with a power of 75% a certain deviation from the median value for each evaluated parameter with the used sampling effort was evaluated. Four classes were defined: (1) when it is possible to detect changes with a factor < 2, the power is evaluated as GOOD; (2) changes with a factor 2-5, the power is evaluated as MODERATE; (3) changes with a factor 5-10, the power is evaluated as LOW; (4) changes with a factor > 10, the power is evaluated as VERY POOR . Percentiles of reference distribution after iteration Other percentile values out of the reference randomization are listed here 0.010 0.732 0.025 0.749 0.050 0.766 0.77399 0.100 0.783 0.250 0.808 0.500 0.827 0.750 0.843 0.900 0.855 0.950 0.860 0.975 0.866 0.990 0.873 SIMILARITY OF ASSESSMENT SAMPLE WITH REFERENCE The assessment value (Bray-Curtis similarity between assessment dataset and reference dataset) 0.06800 PROBABILITY TO FIND LOWER VALUE BY CHANCE Probability calculation to find a lower value for the assessment value by chance 0.93200 PROBABILITY TO FIND HIGHER VALUE BY CHANCE Probability calculation to find a higher value for the assessment value by chance The list below is a list of species which contribute most to the dissimilarity between the assessment and reference dataset (cf SIMPER analysis). CONTRIBUTING SPECIES Species name Contr. dissimil. cyathura carinata 0.0136 psammodrilus balanoglosso 0.0125 polydora ligni 0.0077 proplow 1.0000 1.0000 0.7310 prophigh 0.0000 0.0000 0.2690 8 Guidelines BEQI tool http://www.beqi.eu Version: 14/07/2009 oligochaeta streblospio shrubsolii ensis corophium arenarium aphelochaeta marioni pygospio elegans polydora cornuta 0.0075 0.0075 0.0067 0.0066 0.0063 0.0063 0.0059 0.9790 1.0000 0.9910 0.8525 0.9670 0.8455 0.6060 0.0210 0.0000 0.0090 0.1475 0.0330 0.1545 0.3940 Similar information is listed for the other parameters. 9


