THE DALLES TDG FOREBAY TEMPERATURES DATE
advertisement

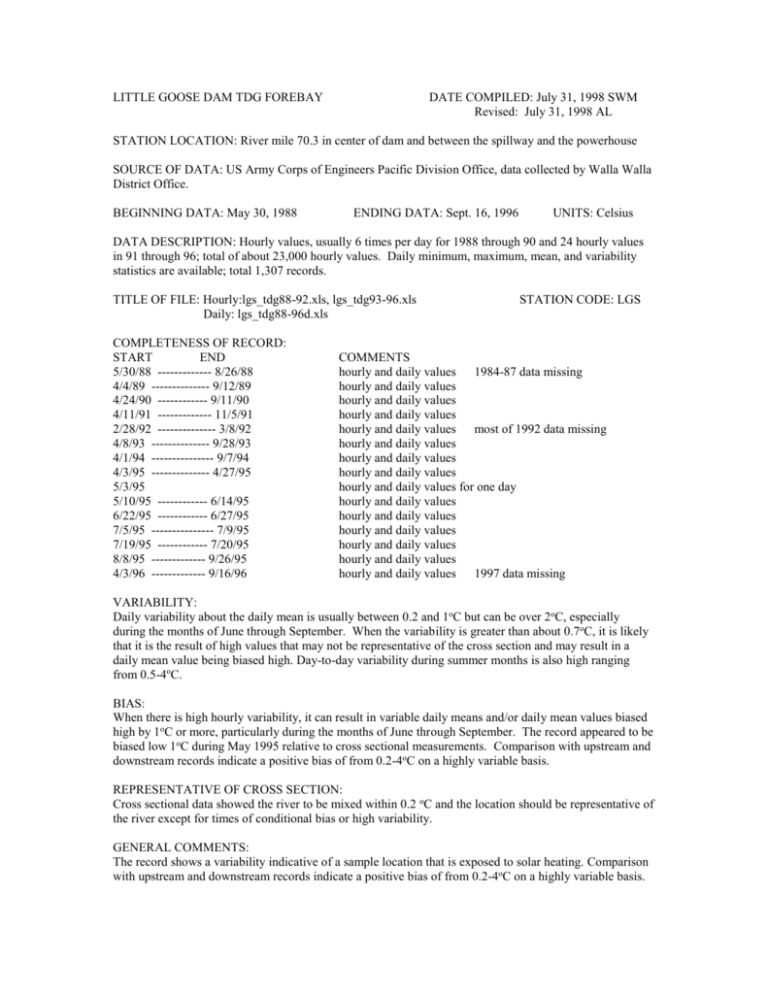
LITTLE GOOSE DAM TDG FOREBAY DATE COMPILED: July 31, 1998 SWM Revised: July 31, 1998 AL STATION LOCATION: River mile 70.3 in center of dam and between the spillway and the powerhouse SOURCE OF DATA: US Army Corps of Engineers Pacific Division Office, data collected by Walla Walla District Office. BEGINNING DATA: May 30, 1988 ENDING DATA: Sept. 16, 1996 UNITS: Celsius DATA DESCRIPTION: Hourly values, usually 6 times per day for 1988 through 90 and 24 hourly values in 91 through 96; total of about 23,000 hourly values. Daily minimum, maximum, mean, and variability statistics are available; total 1,307 records. TITLE OF FILE: Hourly:lgs_tdg88-92.xls, lgs_tdg93-96.xls Daily: lgs_tdg88-96d.xls COMPLETENESS OF RECORD: START END 5/30/88 ------------- 8/26/88 4/4/89 -------------- 9/12/89 4/24/90 ------------ 9/11/90 4/11/91 ------------- 11/5/91 2/28/92 -------------- 3/8/92 4/8/93 -------------- 9/28/93 4/1/94 --------------- 9/7/94 4/3/95 -------------- 4/27/95 5/3/95 5/10/95 ------------ 6/14/95 6/22/95 ------------ 6/27/95 7/5/95 --------------- 7/9/95 7/19/95 ------------ 7/20/95 8/8/95 ------------- 9/26/95 4/3/96 ------------- 9/16/96 STATION CODE: LGS COMMENTS hourly and daily values 1984-87 data missing hourly and daily values hourly and daily values hourly and daily values hourly and daily values most of 1992 data missing hourly and daily values hourly and daily values hourly and daily values hourly and daily values for one day hourly and daily values hourly and daily values hourly and daily values hourly and daily values hourly and daily values hourly and daily values 1997 data missing VARIABILITY: Daily variability about the daily mean is usually between 0.2 and 1oC but can be over 2oC, especially during the months of June through September. When the variability is greater than about 0.7oC, it is likely that it is the result of high values that may not be representative of the cross section and may result in a daily mean value being biased high. Day-to-day variability during summer months is also high ranging from 0.5-4oC. BIAS: When there is high hourly variability, it can result in variable daily means and/or daily mean values biased high by 1oC or more, particularly during the months of June through September. The record appeared to be biased low 1oC during May 1995 relative to cross sectional measurements. Comparison with upstream and downstream records indicate a positive bias of from 0.2-4oC on a highly variable basis. REPRESENTATIVE OF CROSS SECTION: Cross sectional data showed the river to be mixed within 0.2 oC and the location should be representative of the river except for times of conditional bias or high variability. GENERAL COMMENTS: The record shows a variability indicative of a sample location that is exposed to solar heating. Comparison with upstream and downstream records indicate a positive bias of from 0.2-4oC on a highly variable basis.


