The representation of data Transformation
The representation of data Transformation (*)
The representation of the rules to obtain new data from the existing ones is an important feature of the Matrix model. The Matrix object committed to this end is the “Transformation”. It represents the algorithm by which a specific result can be derived from one or more operands. Results and operands are statistical data (named “statistical functions” or simply “cubes” according to the
Matrix vocabulary). The algorithm is a sequence of calculation steps described in a formal syntax
(expression).
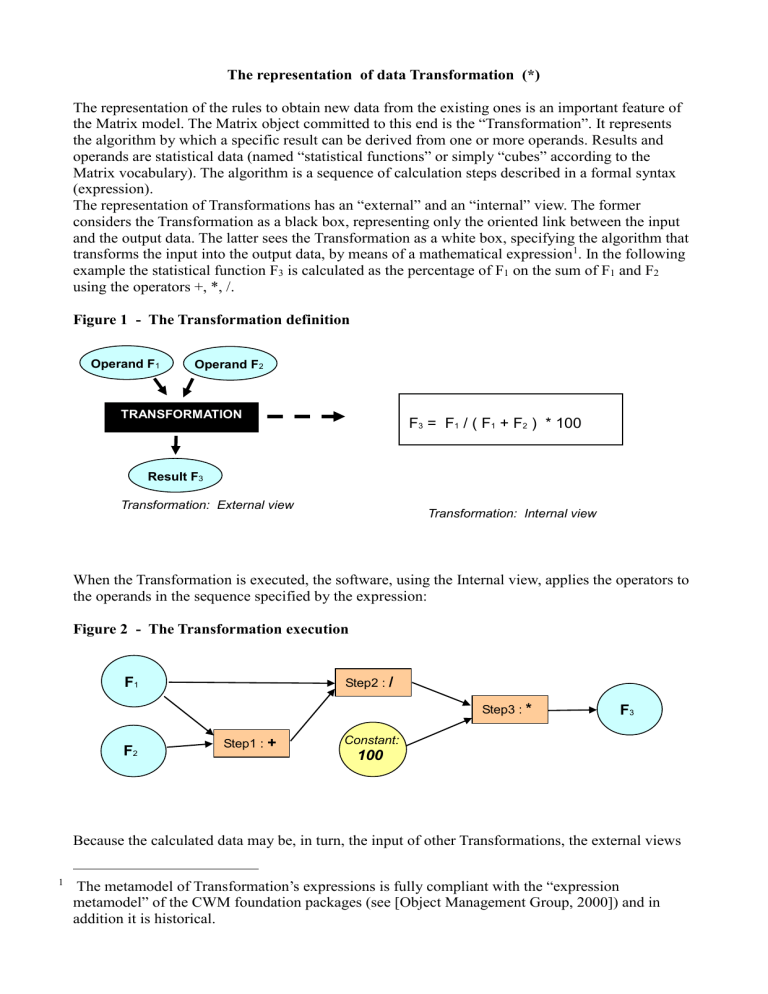
The representation of Transformations has an “external” and an “internal” view. The former considers the Transformation as a black box, representing only the oriented link between the input and the output data. The latter sees the Transformation as a white box, specifying the algorithm that transforms the input into the output data, by means of a mathematical expression
1
. In the following example the statistical function F
3
is calculated as the percentage of F
1
on the sum of F
1
and F
2 using the operators +, *, /.
Figure 1 - The Transformation definition
Operand F
1
Operand F
2
TRANSFORMATION
Result F
3
Transformation: External view
F
3
= F
1
/ ( F
1
+ F
2
) * 100
Transformation: Internal view
When the Transformation is executed, the software, using the Internal view, applies the operators to the operands in the sequence specified by the expression:
Figure 2 - The Transformation execution
F
1
Step2 : /
F
2
Step1 : + Constant:
100
Step3 : * F
3
Because the calculated data may be, in turn, the input of other Transformations, the external views
1
The metamodel of Transformation’s expressions is fully compliant with the “expression metamodel” of the CWM foundation packages (see [Object Management Group, 2000]) and in addition it is historical.
form a “directed acyclic graph”, tracing the calculus sequences of the processing system. As usual, this graph is available to users and the software, fully documenting the calculation system. In executing Transformations, it allows the software to determine the right calculus sequence.
Navigating the graph both in the “direct” and in the “reverse” directions it is possible to determine which outputs contribute to a given input and, vice versa, which inputs derive from a given output, allowing impact analysis and both “input driven” and “output driven” 2 approaches for data production. For example it is easy to determine which calculated data should be refreshed if some collected data change.
Transformations also takes account of the availability of the operands to determine the calculability of the result and to document the latter’s availability, once calculated.
The calculus specifications may be completed with possible external conditions that can drive the execution of a given calculus, business rules to establish “what” has to be processed and “when”, data to be processed together and coherently, and so on.
The Matrix model adopts a specific language called EXL to define expressions. EXL syntax is formally defined using the Backus-Naur Form notation. It includes a large set of operators and the rules for combining operators in expressions.
EXL has been designed recently, within the programme for building INFOSTAT. It takes into account several international initiatives
3
complementing the Bank of Italy’s specific experiences and requirements.
From a theoretical perspective the objects defined in a language are the data types that the language is able to manage and the operators that can be used. The set of adopted symbols is the alphabet of the language.
Concerning the data types, the operands and the results of the EXL operators (and expressions) are obviously Matrix objects,
4
and in particular statistical data (cubes).
5
The Matrix model considers the statistical data as mathematical functions, so the EXL operators comprise mathematical functions to obtain other mathematical functions. This feature makes the language very synthetic and powerful, because a single operation may process a huge number of data occurrences (which are the single values of the function), and very suitable for statistical applications.
The appearance of EXL expressions is very similar to the formulas of a spreadsheet, so it is quite intuitive to define them. As noted earlier, the overall structure of the Transformation expressions is also analogous to the spreadsheet structure (directed acyclic graph). However, while in a spreadsheet the operands and the results are single values, for the EXL they are whole statistical data sets (arrays, time series, multidimensional quantitative and qualitative data).
Furthermore, the language complies with all of the characteristics and features of the data representation model. For instance, the language is “historicity sensitive”, i.e. operators are aware of the historicity of concepts
6
and of their relationships
7
and work accordingly, making proper use of the representation of time changes (and so on) within calculations that involve data at different reference times (e.g., to manage cases of mergers, acquisitions, spin-offs, or changes in the
2 In an output driven process the objective is to identify which inputs are needed to calculate a given output; vice versa in an input driven process the objective is to identify which outputs can be calculated from given inputs.
3
For example MathMl - www.w3.org/Math/; XBRL Formula - www.
xbrl .org/; Microsoft MDX - http://technet.microsoft.com/it-it/library/ms145506.aspx.
4 A language must satisfy the property of “closure“ with respect to the objects of the model.
5 Only the operators for producing new statistical data from existing ones are defined at present.
6 In the Matrix model terminology, concepts are all the components that form the data: variables, sets of values and values themselves.
7 Examples of relationships between concepts are the hierarchical links inside hierarchical lists of codes.
composition of aggregates, hierarchical lists of codes, and so on, as mentioned earlier). The language also takes into consideration the other Matrix meta-information (like the definition of synonym codes, and so on) to be applied within calculation expressions.
The Matrix EXL is also designed to determine automatically not only the “extension” of the result
(that is, the set of data occurrences), but also its “intension” (that is, its definition according to the
Matrix model).
Like the general approach of the Matrix model, the vocabulary of the EXL is at a conceptual level, suitable for use by subject matter experts and independent of any specific IT implementation.
Therefore the EXL supports a very effective role distinction between Business and IT people within an organization: EXL is a tool for the information workers and fosters user autonomy, which is a factor in success in meeting “time to market” and “cost” challenges 8 .
The EXL is conceived as an extensible language, in order to support the great variety and variability of requirements related to statistical data management. New operators can be added according to processing needs.
9
Furthermore, the language allows both basic operators (for example +, -, *, /) and very complex operators (for example, calculation of Herfindahl index, calculation of seasonally adjusted series). Language allows also to define templates for recurring formulas thus improving the language’s simplicity and user-friendliness (templates are ordinary EXL expressions whose operands are placeholders instead of specific cubes).
Finally, the expression language is fully independent of the typical activities related to the statistical data processing (data collection, compilation, dissemination). It can be employed in all such activities and can be also used to trace the graph of operations across them. The calculation of derived data plays a crucial role also in data validation and in fact the very first use of the expression language was to make consistency checks.
The data validation phase is obviously crucial to the improvement of data quality. The first kind of validation is the ‘structural validation’ of the observations, to verify whether the data extensions conform with the definitions. This kind of validation is made possible by the existence of a dictionary (registry) where data structures are defined and doesn’t require calculations. Structural validation, however, does not give a great deal of information about the plausibility and the quality of the data. The “spatial” and “temporal” coherence of the data are evaluated by means of consistency checks, based on calculations. Simple examples are the detection of unusual observations with respect to the likely behaviour (e.g. the detection of abnormal trends across time or of outliers within a population) and the comparison between data having coherence constraints
(e.g. “assets” and “liabilities” of the balance sheets).
10
Consistency checks are treated as normal calculations: they are defined by means of
Transformations using the EXL. The same conceptual language is therefore used to define all types of calculation, independent of the purpose. Consistency checks are thus defined and performed following the same criteria described earlier and with the same advantages. Inter alia, the graph of the consistency checks is part of the overall graph of the Transformations of the statistical information system. And consistency checks may also be applied in other phases of statistical activity (for example, the coherence of derived data can be checked against expectations).
The results of the consistency checks are “cubes” containing information about the data quality of
8
However, nothing prevents the EXL from being used by IT specialists, if desired.
9 The new operators must obviously comply with the Matrix and EXL general principles, in order not to make the system inconsistent.
10 For example, data redundancies may be intentionally used for data quality controls.
other “cubes”. Quality cubes can be used within EXL expressions as any other cube, in addition, they can be used to drive the actions to be performed on the data they refers to (e.g. discarding or accepting them, correcting or estimating them, making them available to some kind of users or not).
*: extract from “
Processing and managing statistical data: a National Central Bank experience
” (Fabio Di
Giovanni, Daniele Piazza – international statistics conference 2009- Prague) –
http://www.czso.cz/conference2009/proceedings/data/process/piazza_paper.pdf

