Supplementary Material
advertisement
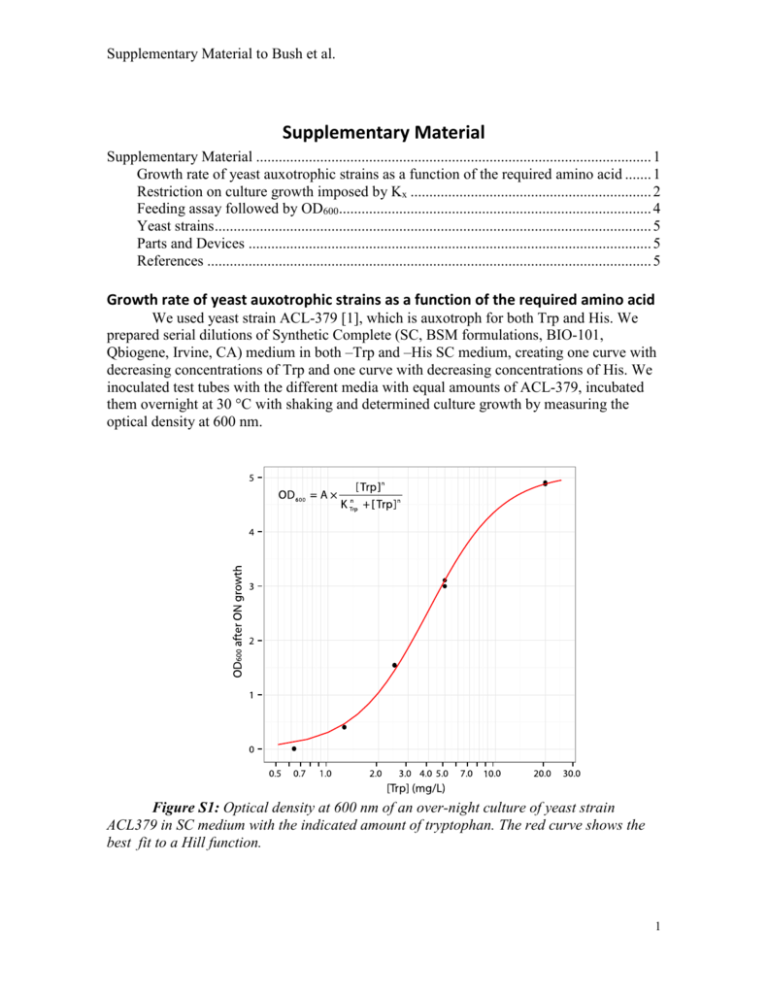
Supplementary Material to Bush et al. Supplementary Material Supplementary Material ......................................................................................................... 1 Growth rate of yeast auxotrophic strains as a function of the required amino acid ....... 1 Restriction on culture growth imposed by Kx ................................................................ 2 Feeding assay followed by OD600................................................................................... 4 Yeast strains .................................................................................................................... 5 Parts and Devices ........................................................................................................... 5 References ...................................................................................................................... 5 Growth rate of yeast auxotrophic strains as a function of the required amino acid We used yeast strain ACL-379 [1], which is auxotroph for both Trp and His. We prepared serial dilutions of Synthetic Complete (SC, BSM formulations, BIO-101, Qbiogene, Irvine, CA) medium in both –Trp and –His SC medium, creating one curve with decreasing concentrations of Trp and one curve with decreasing concentrations of His. We inoculated test tubes with the different media with equal amounts of ACL-379, incubated them overnight at 30 °C with shaking and determined culture growth by measuring the optical density at 600 nm. Figure S1: Optical density at 600 nm of an over-night culture of yeast strain ACL379 in SC medium with the indicated amount of tryptophan. The red curve shows the best fit to a Hill function. 1 Supplementary Material to Bush et al. Figure S2: Optical density at 600 nm of an over-night culture of yeast strain ACL379 in SC medium with the indicated amount of histidine. The red curve shows the best fit to a Hill function. We estimated the effective concentrations KHis and KTrp, and the corresponding Hill exponents by fitting a Hill function to the data. We obtained KTrp = 1.17±0.04·1016 amino acids/ml and nTrp = 1.98±0.11. In an analogous manner we determined KHis = 2.98±0.29·1016 amino acids/ml and nHis = 1.44±0.10. Restriction on culture growth imposed by Kx The growth condition depicted in Figure 2C is related to the concentrations of amino acids that the culture manages to accumulate during the lag phase. Even if the amount of AA secreted in the life of a cell is enough to make several daughter cells (i.e. parameters in Region II), the concentration of amino acids still have to reach levels that allow the cells to incorporate them. This is to say that the concentration of AAx built up during the lag phase has to reach values close to Kx. To formalize this notion we define the effective concentration ECx, as the concentration of AAx required to get % of the maximal growth rate for strain Nx: EC xn K xn EC xn [S1] 2 Supplementary Material to Bush et al. For example, the EC50x is the concentration of AAx required to get 50% of the maximal growth rate (note that EC50x=Kx), and EC10x is the concentration required to get 10% of the maximal growth rate. We can approximate the amount of amino acids secreted by each strain during the lag phase by assuming that during this phase there is no cell growth. In other words, we assume AAx << Kx and therefore the first term in equations 1 and 2, and the second term in equations 3 and 4 vanish, resulting in the following decoupled equations Nx D Nx [S2] AAy p y N x [S3] where x=a and y=b, or x=b and y=a. Integrating we get AAx (t ) N yt 0 px D (1 e Dt ) [S4] For the culture to grow the quantity AAx(t)=Nyt=0px/D has reach some critical value ECx, with D/kmax < ≤ 1. The lower bound for (l) comes from considering that the concentration of AAx has to be more than enough to compensate for the death rate. This ˙ =0 and Nx+Ny << CC, and replacing can be calculated from equation 1 by assuming N x with equation S1. 0 N x kmax l D N x [S5] Solving equation S5 for l gives the lower bound. For the parameters used in this work l=0.07. Note that only one of the amino acids concentration is required to reach the critical value for the culture to grow. For example, if the concentration of AAa secreted by Nb during the lag phase reaches ECa, then Na will grow and secret more AAb, which will in turn allow Nb to grow. To determine which AAx will reach the critical ECx first, we can compare the quantities Nat=0pb/Kb to Nbt=0pa/Ka . If the first one is larger than the second one, then AAb will reach the critical value first and vice-versa. The AAx that reaches the critical value first defines the boundary in Figure 2C. Solving equation S1 for ECx, equating to the asymptotic value of equation S4 [AAx(t)] and taking logarithm we get the expression for the boundary of Figure 2C. D 1 1 Log ( N yt 0 ) Log ( K x ) Log Log px n [S9] The exact value for depends on the length of the simulation used to determine if the coculture grows. With the parameter set used in this work, and a simulation length of 3 Supplementary Material to Bush et al. 300 hours, we found a critical of 0.3. Increasing the simulation length to 10000 hours, decreases to 0.25. As the simulation length increases, asymptotically tends to l= D/kmax=0.07. Feeding assay followed by OD600 The coculture experiments were performed as described in the methods section of the main text. Tubes containing -H-T medium (synthetic medium without His and Trp) were inoculated at a initial cell density of OD600=0.01. Three biological replicates were done for each coculture condition. Tubes were incubated at 30ºC with shaking for 48 hours. At the end of the experiment the OD600 of each tube was measured in a spectrophotometer. The results are shown in figure S3. Pure cultures showed a small increase in optical density, when compared to the original inoculum, reaching OD600 of 0.0260.005, 0.040.01 and 0.0490.007 for H-, T- and (H- secretion 1) strains respectively. Coculture of the strains not engineered to crossfeed (culture T- H-) showed no significant difference in growth compared to cultures T- and (H- secretion 1) (Tukey’s honestly significant difference). The T- and (H- secretion 1) coculture shows significantly higher values of OD600 compared to all other cultures (Tukey’s honestly significant difference). Figure S3: Optical density at 600 nm of pure cultures or cocultures of the indicated strains, after two days of growth at 30ºC with shaking. 4 Supplementary Material to Bush et al. Yeast strains The Saccharomyces cerevisiae yeast strains used in this study are derivatives from YACL‐379 (MATa can1::HO‐CAN1 ho::HO‐ADE2 ura3 ade2 leu2 trp1 his3 bar1) strain of W303a genetic background [1]. Strain Relevant Genotype ACL379 (parental strain) [1] TCY3081 ura3::PACT1-YFP::URA3 [1] TCY3128 leu2::PPRM1-CFP::LEU2 [1] YAG3905 leu2::PPRM1-CFP::LEU2 harboring pEG202 [this study] Table S1: Relevant genotypes of yeast strains used in this study. Parts and Devices Plasmid/device Description BBa_J63003 consensus Kozak sequence and start codon [Silver Lab 2006] BBa_K416003 Yeast secretion Tag [iGEM10_NYU 2010] BBa_K792001 Kozak sequence from yeast α-factor mating pheromone [this study] BBa_K792002 Secretion tag from yeast α-factor mating pheromone [this study] BBa_K792003 Import enhancer - HIV TAT penetratin (trojan peptide) [this study] BBa_K792006 Tryptophan rich peptide (TrpZipper2) [this study] BBa_K792008 Tryptophan rich peptide (PolyWb) [this study] BBa_K792010 Yeast exportable Trp-rich peptide with penetratin 1 [this study] BBa_K792012 Yeast exportable Trp-rich peptide with penetratin 2 [this study] Table S2: Description of genetic parts and devices used in this study. References 1. Colman-Lerner, A., et al., Regulated cell-to-cell variation in a cell-fate decision system. Nature, 2005. 437(7059): p. 699-706. 5

