SAMPLE CHEMISTRY PERFORMANCE ASSESSMENT
advertisement
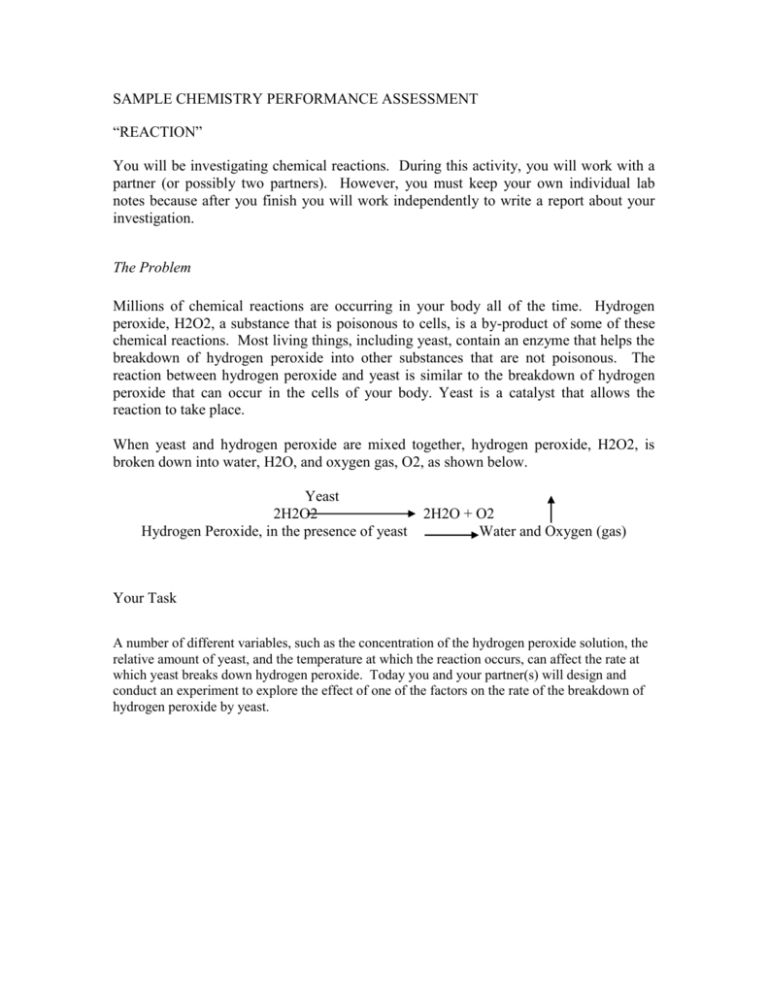
SAMPLE CHEMISTRY PERFORMANCE ASSESSMENT “REACTION” You will be investigating chemical reactions. During this activity, you will work with a partner (or possibly two partners). However, you must keep your own individual lab notes because after you finish you will work independently to write a report about your investigation. The Problem Millions of chemical reactions are occurring in your body all of the time. Hydrogen peroxide, H2O2, a substance that is poisonous to cells, is a by-product of some of these chemical reactions. Most living things, including yeast, contain an enzyme that helps the breakdown of hydrogen peroxide into other substances that are not poisonous. The reaction between hydrogen peroxide and yeast is similar to the breakdown of hydrogen peroxide that can occur in the cells of your body. Yeast is a catalyst that allows the reaction to take place. When yeast and hydrogen peroxide are mixed together, hydrogen peroxide, H2O2, is broken down into water, H2O, and oxygen gas, O2, as shown below. Yeast 2H2O2 Hydrogen Peroxide, in the presence of yeast 2H2O + O2 Water and Oxygen (gas) Your Task A number of different variables, such as the concentration of the hydrogen peroxide solution, the relative amount of yeast, and the temperature at which the reaction occurs, can affect the rate at which yeast breaks down hydrogen peroxide. Today you and your partner(s) will design and conduct an experiment to explore the effect of one of the factors on the rate of the breakdown of hydrogen peroxide by yeast. MATERIALS You have been provided with the following materials and equipment. It may not be necessary to use all of the equipment that has been provided. You may use additional materials or equipment if they are available: Hydrogen peroxide Forceps Packet of yeast 5 paper cups 20 pieces of felt 1 small lid for paper cup 5 test tubes, brush, and rack 2 Styrofoam cups Labeling dots 2 lids for Styrofoam cups Access to ice/ice water 3 plastic spoons Access to tap water Graduated cylinder Access to a clock with a second hand Thermometer Access to a calculator Access to warm water (500-600C) Paper towels for cleanup Balloons/ Gas collectors Safety equipment to include splashproof goggles and aprons Yeast solution should be anywhere from 50 to 200 ml of water for each packet. Hydrogen peroxide should be anywhere from 100 to 500 ml of water for every 10 ml of hydrogen peroxide. One method to time the rate of the reaction is to fill one test tube about 3/4 full with the hydrogen peroxide solution. Using the forceps, soak a piece of felt in the yeast solution and then drop it into the test tube containing hydrogen peroxide solution. The felt should sink to the bottom of the test tube. As the yeast helps break down the hydrogen peroxide, oxygen gas bubbles are formed on the felt and it rises to the top as illustrated in the diagram below. Another method is to time how long it takes a balloon to fill with oxygen gas. “REACTIONS” DIRECTIONS: 1. Select one variable, either temperature or the concentration of the hydrogen peroxide solution or concentration of yeast solution. You will explore the effect of this variable on the rate of breakdown of hydrogen peroxide by yeast. 2. In your own words, clearly state the problem you are going to investigate. Include a clear definition of the independent and dependent variables that will be studied. 3. Design an experiment to solve the problem. Your experimental design should match your statement of the problem, should control the variables, and should be clearly described so that someone else could easily replicate your experiment. Include a control if appropriate. Show your design to your teacher before you begin your experiments. 4. After receiving permission from your teacher, work with your partner to carry out your experiments. Your teacher’s approval does not necessarily mean that your teacher thinks your experiments are well designed. It simply means that in your teacher’s judgment your experiments are not dangerous or likely to cause an unnecessary mess. 5. While conducting your experiments, take careful notes on the pages provided. Space is also provided for charts, tables, or graphs. Your notes will not be scored, but they will be helpful to you later as you work independently to write about your experiments and the results. You must keep your own notes because you will not work with your lab partner when you write your report. Directions for Writing Your Laboratory Report Working on your own, summarize your experiments and results. You may use your own notes that you took previously while working with your partner Your report should include: A clear statement of the problem you investigated. Include a clear identification of the independent and dependent variables that were studied. A description of the experiment you carried out. Your description should be clear and complete enough so that someone could easily replicate your experiment. The results of your experiment. Tables, charts, and/or graphs should be used where appropriate and should be properly labeled. Space for your data is provided. Your conclusions from your experiment. State the trends you found as accurately as possible. Your conclusions should be fully supported by data. Comments about how valid you think your conclusions are. In other words, how much confidence do you have in your results and conclusions? Any factors that contribute to a lack of confidence in the results or conclusions should be discussed. Also, include the ways that your experiment could be improved if you were to do it again. Science Performance Task Analytic Scoring DIMENSION SCORE Problem Definition The problem is stated clearly. Clear identification of independent and dependent variables ................................... 3 The problem is stated adequately. Adequate identification of independent and dependent variables .......................................................................................................................................................................... 2 The problem is poorly stated. Poor identification of independent and dependent variables ................................... 1 The statement of the problem is very limited or missing altogether. No identification of variables ....................... 0 Experimental Design The experimental design matches the stated problem. Variables are controlled. The procedures are clear, complete, and replicable. A control is included if appropriate ...................................................... 3 The experimental design generally matches the stated problem. Attempt at controlling variables is made. Procedures are generally complete. Minor modifications or clarifications may be needed ......................................................................................................................................................................... 2 The experimental design matches the stated problem to some extent. Little attempt to control variables. Procedures are incomplete. Major modifications or clarifications may be needed ................................................. 1 The experimental design does not match the stated problem, is very incomplete or missing. There is no attempt to control variables ......................................................................................................................... 0 Data Presentation (Graphs) Data are well organized and presented in an appropriate manner ............................................................................ 3 Data are organized and presented in an appropriate manner. Minor errors or omissions may be present......................................................................................................................................................................... 2 Data are poorly organized or presented in an inappropriate manner. Major omissions or errors may be present ................................................................................................................................................................. 1 Data are very poorly organized or presented in an inappropriate manner or missing altogether ............................. 0 Conclusions/Validity Conclusions are related to the stated problem and fully supported by data and the validity of .the conclusions are discussed ......................................................................................................................................... 3 Conclusions are generally related to the stated problem and supported by data. Minor errors in interpretation of results may be present. Discussion of the validity of conclusions is limited ....................................................... 2 Conclusions are related to the stated problem and supported by data to a limited extent. Major errors in the interpretation of results may be present. There is little discussion of the validity of conclusion ........................................................................................................................................................................ 1 Conclusions are not related to the stated problem, not supported by data or are missing. There is no discussion of conclusions ........................................................................................................................................ 0 REACTIONS ASSESSMENT QUESTIONS Students in a science class conducted experiments to explore the effects of various factors on the reaction of yeast and hydrogen peroxide. In the reaction, hydrogen peroxide, H2O2, is broken down into water, H2O, and oxygen gas, O2. Two groups of students decided to investigate the effect of the concentration of hydrogen peroxide solution on the reaction. Their experimental procedures and results are shown below. Group A We took four test tubes and placed the following in each. Test tube #1-20 mL of hydrogen peroxide and 5 mL of water Test tube #2-15 mL of hydrogen peroxide and 5 mL of water Test tube #3-10 mL of hydrogen peroxide and 5 mL of water Test tube #4-5 mL of hydrogen peroxide and 5 mL of water For each test tube we dipped a piece of felt in a yeast and water mixture and placed it in a test tube. The piece of felt sank. We measure the time it took the felt to rise to the top of the test tube. Our results are as follows: Test Tube 1 2 3 4 Time For Felt to Rise 24 seconds 48 seconds 55 seconds 61 seconds Group B We took five test tubes and placed the following amounts of hydrogen peroxide and water into each: Test Tube 1 2 3 4 5 Hydrogen Peroxide 20 mL 15 mL 10 mL 5 mL 0 mL Water 0 mL 5 mL 10 mL 15 mL 20 mL We then cut five pieces of felt and dipped them into a mixture of one packet of yeast and 200 mL of water. We then placed a piece of felt in each of the test tubes and recorded our observations. Our results are shown below. Test Tube Observations 1 very cloudy, a lot of bubbles, felt sank and then rose quickly 2 cloudy, bubbles, felt sank and then rose slowly 3 cloudy, some bubbles, felt sank and then rose slowly 4 a little cloudy, a few bubbles, felt sank and then rose very slowly 5 clear, no bubbles formed, felt sank and did not rise Answer the following questions: 1. Compare the two experiments. Which experiment, if either, is better designed? Fully explain your answer. 2. Group B was not sure why the felt did not rise to the top of test tube number five. What is the most likely reason for this? Explain your answer fully. Group C designed and carried out the following experiment. 1. We placed a solution of hydrogen peroxide and water into four test tubes. 2. We put one test tube in a beaker of ice water, one test tube in a beaker of warm water, one test tube in a beaker of hot water, and one test tube was left at room temperature. We measured the temperature in each tube. 3. We dipped four pieces of felt into a yeast solution and dropped them into the test tubes. We recorded our observations and measured the length of time for the felt to rise in each test tube. Our data is shown below. 1 2 3 4 8 22 30 41 Test Tube Temperature In degrees C Observations Time for felt to rise in seconds A few bubbles formed 47 Bubbles formed Bubbles formed A lot of bubbles formed 32 23 17 3. Draw a graph of Group C’s results. Be sure to label the graph. 4. Using similar equipment, design an experiment to investigate whether or not pH affects the reaction between hydrogen peroxide and yeast.Your experiment should be clear enough so that someone else could easily replicate it. Teacher Answer Key “Reaction” 1. Compare the two experiments. Which experiment, if either, is better designed? Fully explain your answer. This item assesses students’ understanding of what constitutes an appropriate experimental design. In this case, both experiments have flaw in their designs. Students stating that experiment A is better could note that A obtained quantitative results, time for felt to rise, rather than only qualitative results, observations, for group B. Students stating that experiment B is better could note that group B included a control, test tube five with no hydrogen peroxide, and kept the total volume of liquid in the test tube constant throughout the experiment. Both experimental designs also ran only one trial for each concentration. 2. Group B was not sure why the felt did not rise to the top of test tube number five. What is the most likely reason for this? Explain your answer fully. This item assesses students’ ability to interpret observations from an experiment. The felt did not rise in test tube five because there was no hydrogen peroxide present. In the experiment, yeast causes the breakdown of hydrogen peroxide into water and oxygen gas. As the oxygen bubbles form, they attach to the felt causing it to rise. Students may note that test tube five acts as the control in the experiment and therefore no reaction is expected. 3. Draw a graph of Group C’s results. Be sure to label the graph. This item assesses students’ abilities to draw a graph from data resulting from an experiment. Either a line graph or a bar graph is appropriate. For a line graph, temperature verses time for the felt to rise should be plotted. For a bar graph, the number of the test tube should be plotted verses the temperature or time for the felt to rise. For either type of graph, axes should be properly labeled, including units. The axes should be scaled appropriately and data points plotted correctly. 4. Using the equipment provided below, design an experiment to investigate whether or not pH affects the reaction between hydrogen peroxide and yeast.Your experiment should be clear enough so that someone else could easily replicate it. This item assesses the students’ ability to design an appropriate experiment. The following characteristics are desirable. The independent variable, pH, is appropriately tested in the experiment. An indication of how the dependent variable will be measured (e.g., time for the felt to rise in the test tube). Clear and complete procedures that could easily be replicated. An indication that variables will be controlled (e.g., amounts of material, volume of solution). Indicates a control (e.g., a hydrogen peroxide solution with no acid or base added). Repeated trials. Scoring Guidelines for Science Open-Ended Questions. Open-ended questions are those that require a student to write a short response to a question. This method involves judging the over-all quality of the student response. Scoring criteria is based upon a reasonable expectation of grade ten students responding under test conditions. These questions are scored on a scale of zero to three with three being the highest. An excellent answer is scored as a three. It is correct, complete and appropriate and contains elaboration extension and/or evidence of higher-order thinking and relevant prior knowledge. There is no evidence of misconceptions. Minor errors will not necessarily lower the score A proficient answer is scored as a two. It is generally correct, complete, and appropriate although minor inaccuracies may appear. There may be limited evidence of elaboration, extension, higher order thinking, an relevant prior knowledge, or there may be significant evidence of these traits but other flaws (e.g. inaccuracies, omissions, inappropriateness) may be more than minor. A marginal answer is scored as a one. The response to a marginal answer may contain some elements of proficient response. It is inaccurate, incomplete and/or inappropriate. There is little, if any, evidence of elaboration, extension, higher-order thinking or relevant prior knowledge. There may be significant misconceptions. An unsatisfactory answer is scored as a zero. The response, although on topic, is an unsatisfactory answer to the question. It may fail to address the question, or it may address the question in a very limited way. There may be no evidence of elaboration, extension, higher-order thinking, or relevant prior knowledge. There may be evidence of serious misconceptions.

