1 passenger miles flown on Northeast Airplanes, a commuter firm

HOMEWORK FOR FORECASTING
I strongly recommend that you solve the HW problems (Problem 3 in particular) by a spreadsheet program. Otherwise, the calculations involved can be very tedious.
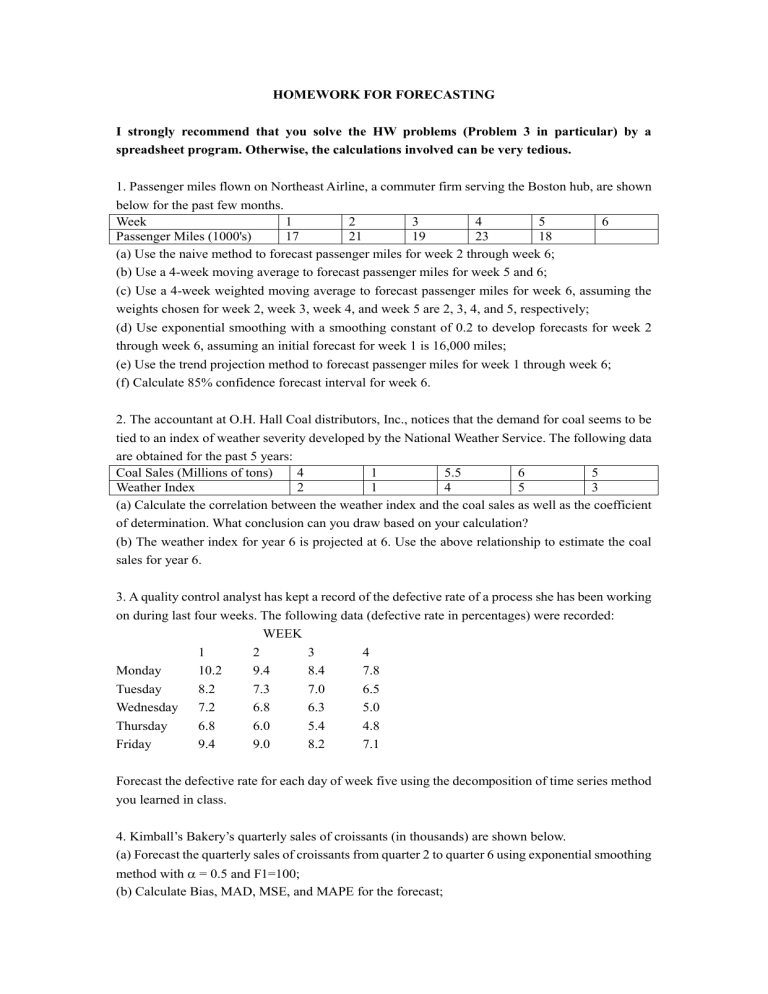
1. Passenger miles flown on Northeast Airline, a commuter firm serving the Boston hub, are shown below for the past few months.
Week
Passenger Miles (1000's)
1
17
2
21
3
19
4
23
5
18
(a) Use the naive method to forecast passenger miles for week 2 through week 6;
(b) Use a 4-week moving average to forecast passenger miles for week 5 and 6;
6
(c) Use a 4-week weighted moving average to forecast passenger miles for week 6, assuming the weights chosen for week 2, week 3, week 4, and week 5 are 2, 3, 4, and 5, respectively;
(d) Use exponential smoothing with a smoothing constant of 0.2 to develop forecasts for week 2 through week 6, assuming an initial forecast for week 1 is 16,000 miles;
(e) Use the trend projection method to forecast passenger miles for week 1 through week 6;
(f) Calculate 85% confidence forecast interval for week 6.
2. The accountant at O.H. Hall Coal distributors, Inc., notices that the demand for coal seems to be tied to an index of weather severity developed by the National Weather Service. The following data are obtained for the past 5 years:
Coal Sales (Millions of tons)
Weather Index
4
2
1
1
5.5
4
6
5
5
3
(a) Calculate the correlation between the weather index and the coal sales as well as the coefficient of determination. What conclusion can you draw based on your calculation?
(b) The weather index for year 6 is projected at 6. Use the above relationship to estimate the coal sales for year 6.
3. A quality control analyst has kept a record of the defective rate of a process she has been working on during last four weeks. The following data (defective rate in percentages) were recorded:
WEEK
1 2 3 4
Monday 10.2 9.4 8.4 7.8
Tuesday 8.2 7.3 7.0 6.5
Wednesday 7.2 6.8 6.3 5.0
Thursday 6.8 6.0 5.4 4.8
Friday 9.4 9.0 8.2 7.1
Forecast the defective rate for each day of week five using the decomposition of time series method you learned in class.
4. Kimball’s Bakery’s quarterly sales of croissants (in thousands) are shown below.
(a) Forecast the quarterly sales of croissants from quarter 2 to quarter 6 using exponential smoothing method with
= 0.5 and F1=100;
(b) Calculate Bias, MAD, MSE, and MAPE for the forecast;
(c) Calculate the tracking signal (TS) for each forecast. Plot the TS’s in the 3-sigma control chart and draw a conclusion on the forecast method.
Quarter Actual Sales Forecast Fore. Err |Fore. Err| RSFE(t) MAD(t) TS(t)
1 90 100
2 95
3 115
4 100
5 125
6 140


