tensile test experiment
advertisement
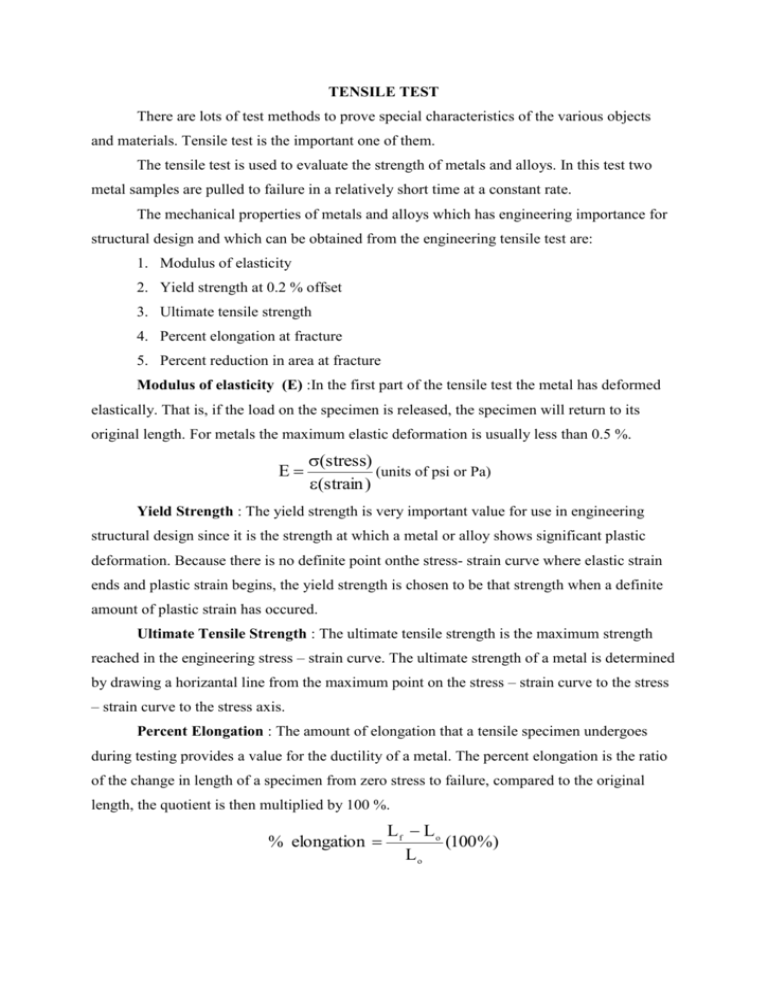
TENSILE TEST There are lots of test methods to prove special characteristics of the various objects and materials. Tensile test is the important one of them. The tensile test is used to evaluate the strength of metals and alloys. In this test two metal samples are pulled to failure in a relatively short time at a constant rate. The mechanical properties of metals and alloys which has engineering importance for structural design and which can be obtained from the engineering tensile test are: 1. Modulus of elasticity 2. Yield strength at 0.2 % offset 3. Ultimate tensile strength 4. Percent elongation at fracture 5. Percent reduction in area at fracture Modulus of elasticity (E) :In the first part of the tensile test the metal has deformed elastically. That is, if the load on the specimen is released, the specimen will return to its original length. For metals the maximum elastic deformation is usually less than 0.5 %. (stress) (units of psi or Pa) (strain ) Yield Strength : The yield strength is very important value for use in engineering structural design since it is the strength at which a metal or alloy shows significant plastic deformation. Because there is no definite point onthe stress- strain curve where elastic strain ends and plastic strain begins, the yield strength is chosen to be that strength when a definite amount of plastic strain has occured. Ultimate Tensile Strength : The ultimate tensile strength is the maximum strength reached in the engineering stress – strain curve. The ultimate strength of a metal is determined by drawing a horizantal line from the maximum point on the stress – strain curve to the stress – strain curve to the stress axis. Percent Elongation : The amount of elongation that a tensile specimen undergoes during testing provides a value for the ductility of a metal. The percent elongation is the ratio of the change in length of a specimen from zero stress to failure, compared to the original length, the quotient is then multiplied by 100 %. % elongation Lf Lo (100 %) Lo L f final length L o initial length Percent Reduction in area : The ductility of a metal or alloy can also be expressed in terms of the percent reduction in area. Using the measurements of the initial and final diameters, the percent reduction in area can be determined from the equation; % reduction in area Af Ao (100 %) Ao A f final area A o initial area Ductility and Brittleness :Ductility and brittleness are the terms used to describe how much a material could deform plastically. A ductile material is the one which can undergo plastic deformation before it breaks. A brittle material is the one which does not deform plastically or exhibits negligible amount of plastic deformation prior to fracture. Certain types of brass, cast iron and glass are the common examples of brittle materials. Toughness : Toughness is the ability of a material to absorb energy in the plastic range. In its actual sense, toughness is the area under the plastic curve including the fracture point. This area is an indication of the amount of work Per unit volume which can be done on the material without causing it to rupture. Toughness Index Number, To, is employed to compare the toughness of different materials. To S t f where S t is the tensile strength of the material and f is the fracture strain. TENSILE TEST EXPERIMENT In this experiment steel and brass were tested. Steel specimen has a diameter 5mm and a gauge length 26mm. F w E E G Where E: gripped ends, may be threaded, plair or with hole gripping by machine G: marked gauge length to precisely measured the length before during and after test F: fillet to reduce stress concentration w: reduced width to ensure specimen breaks in middle-round on round specimen and flat on flat specimens. For Steel L o original gauge length of steel = 26mm d o original diameter of steel = 5mm The body will change its dimensions. The change in a physical dimension is called “deformation”. The steel was pulled by the force F. Tension happened on the steel. The length of the steel extended and area of steel reduced due to increasing tension. Finally the steel was broken by the effect of tension. Breaking of steel can be seen at the graph. After breaking L f gauge length of steel after fracture = 29.5mm d f diameter of steel after fracture = 3.6mm The length of steel increased but the diameter of steel reduced. For Brass L o original gauge length of brass = 21mm d o original diameter of brass = 5mm Breaking of brass can be seen at the graph. After breaking L f gauge length of steel after fracture = 29mm d f diameter of steel after fracture = 2.8mm The length of steel increased but the diameter of steel reduced. CALCULATIONS: For Steel Reduction in area: d 52 Ao o = 19.635 mm2 4 4 2 d f 3.8 2 Af 11.34115 mm2 = 4 4 2 % reduction in area Af Ao (100 %) Ao % reduction in area 11.34115 19.635 (100%) 42.2 19.635 % elongation Lf Lo (100 %) Lo % elongation 31 26 (100 %) 19.2 26 We have found in experiment % elongation =19 and %reduction in diameter=35 For Brass Reduction in area: d o 52 Ao 19.635 mm2 = 4 4 2 d f 2.82 Af = 6.157 mm2 4 4 2 % reduction in area Af Ao (100 %) Ao % reduction in area 6.157 19.635 (100%) 68.6 19.635 % elongation Lf Lo (100 %) Lo % elongation 29 21 (100%) 38 21 We have found in experiment % elongation =35 and %reduction in =40 For Steel 70 60 stress 50 40 30 20 10 0 0,2 0,7 1,3 1,8 2,4 3,4 4 5 5,5 6,9 7,4 elongation For Brass 60 50 stress 40 30 20 10 0 1,65 2,3 2,8 3,7 9 9,7 elongation For Steel; Fult=1240kg Ff = 890kg Fy = 1180kg Sy Su Fy Ao 1180 60.1kg / mm 2 19.635 Fu 1240 63.15kg / mm 2 A o 19.635 11,5 Ff 890 45.33kg / mm 2 A o 19.635 Sf a) E 60.1 313.02kg / mm 2 (at yield point) 0.192 E 63.15 328.91kg / mm 2 (at ultimate point) 0.192 E 45.33 236.094 kg / mm 2 (at fracture point) 0.192 2 1 Sy 5,77 b) u (resillienc e) 2 E c) To Sut f 63.15 * 0.285 18.22 For Brass; Fult=1040kg Fy = 980kg Sy Su Fy Ao 980 49.91kg / mm 2 19.635 Fu 1040 52.97 kg / mm 2 A o 19.635 a) E E 49.91 131kg / mm 2 (at yield point) 0.381 52.97 139 kg / mm 2 (at ultimate point) 0.381 2 1 Sy 9.508 b) u (resillienc e) 2 E c) To Sut f 52.97 * 0.614 32.54 CONCLUSION This experiment has done on the two different materials: steel and brass. As a result of the experiment, spoiling formed on the materials, legth of the materials increased and area of the materials reduced. Acording to the graphs, for brass and steel the elastic behaviour is linearly up. After elastic limit, graphic is not changing linearly. Because metal properties are changing after that point. For relatively ductile materials the failure strength is less than the ultimate tensile strength and necking procedes fracture. For a brittle material fracture usually terminates the stress-strain curve before necking and possibly before the onset of plastic flow. That is why the steel is a ductile material and the brass is a brittle material from graphs. As we can see in the graph, elongation of brittle material is bigger than the ductile material. In contrast, reduction of area of steel is bigger than the brass. A ductile material can undergo plastic deformation before it breaks. A brittle material does not deform plastically or exhibits negligible amount of plastic deformation prior to fracture. Ductile material is typified by the cup and core fracture but brittle material fracture by shear and sliding along and inclined plane.
