Cell Cycle & Cancer Lab: Mitotic Index Analysis
advertisement
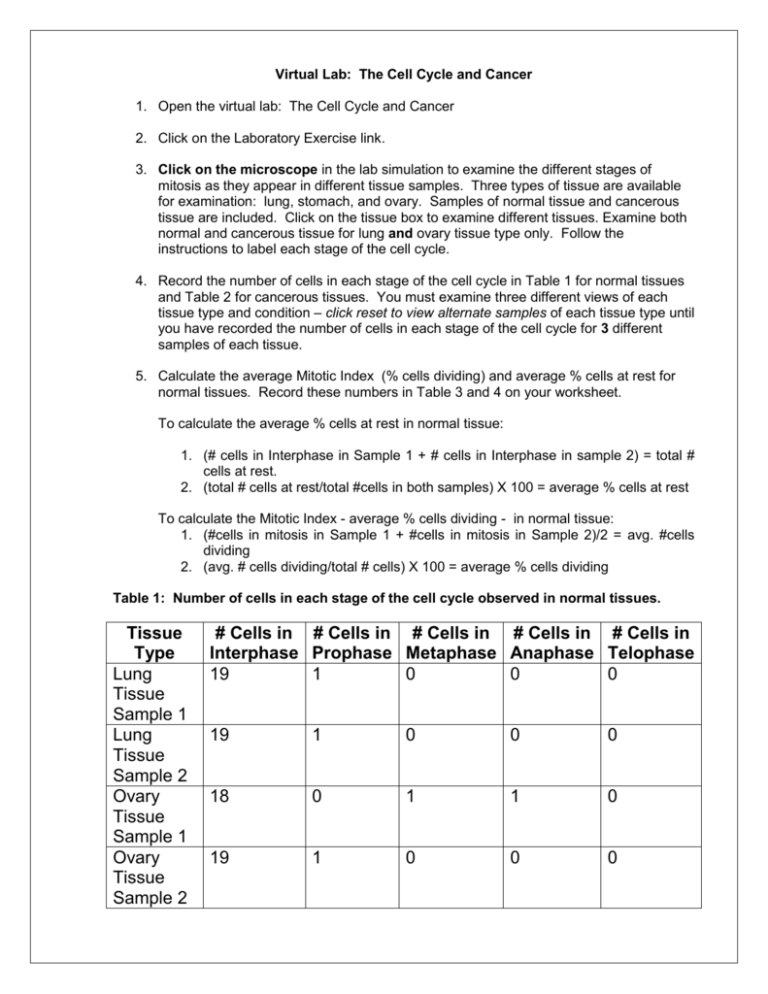
Virtual Lab: The Cell Cycle and Cancer 1. Open the virtual lab: The Cell Cycle and Cancer 2. Click on the Laboratory Exercise link. 3. Click on the microscope in the lab simulation to examine the different stages of mitosis as they appear in different tissue samples. Three types of tissue are available for examination: lung, stomach, and ovary. Samples of normal tissue and cancerous tissue are included. Click on the tissue box to examine different tissues. Examine both normal and cancerous tissue for lung and ovary tissue type only. Follow the instructions to label each stage of the cell cycle. 4. Record the number of cells in each stage of the cell cycle in Table 1 for normal tissues and Table 2 for cancerous tissues. You must examine three different views of each tissue type and condition – click reset to view alternate samples of each tissue type until you have recorded the number of cells in each stage of the cell cycle for 3 different samples of each tissue. 5. Calculate the average Mitotic Index (% cells dividing) and average % cells at rest for normal tissues. Record these numbers in Table 3 and 4 on your worksheet. To calculate the average % cells at rest in normal tissue: 1. (# cells in Interphase in Sample 1 + # cells in Interphase in sample 2) = total # cells at rest. 2. (total # cells at rest/total #cells in both samples) X 100 = average % cells at rest To calculate the Mitotic Index - average % cells dividing - in normal tissue: 1. (#cells in mitosis in Sample 1 + #cells in mitosis in Sample 2)/2 = avg. #cells dividing 2. (avg. # cells dividing/total # cells) X 100 = average % cells dividing Table 1: Number of cells in each stage of the cell cycle observed in normal tissues. Tissue Type Lung Tissue Sample 1 Lung Tissue Sample 2 Ovary Tissue Sample 1 Ovary Tissue Sample 2 # Cells in # Cells in # Cells in # Cells in # Cells in Interphase Prophase Metaphase Anaphase Telophase 19 1 0 0 0 19 1 0 0 0 18 0 1 1 0 19 1 0 0 0 Table 2: Number of cells in each stage of the cell cycle observed in cancerous tissues. Tissue Type Stomach Tissue Sample 1 Stomach Tissue Sample 2 Ovary Tissue Sample 1 Ovary Tissue Sample 2 # Cells in # Cells in # Cells in # Cells in # Cells in Interphase Prophase Metaphase Anaphase Telophase 14 2 1 1 2 13 2 2 2 1 12 2 1 2 3 10 2 2 3 2 Table 3: Mitotic Index (average % cells dividing) and Avg. % of cells at rest Tissue Type Stomach - normal Ovary - normal Avg. % cells at rest (19/20)+(19/20)/2 X100 = 95% (18/20)+(19/20)/2 x100 = 92.5% Mitotic Index = 100-95 = 5% = 100-92.5 = 7.5% Table 4: Mitotic Index (average % cells dividing) and Avg. % of cells at rest Tissue Type Avg. % cells at rest Stomach - cancerous (14/20)+(13/20)/2 X100 = 67.5% Ovary - cancerous (12/20) + (10/20)/2 x 100 = 55 % Analysis Questions Mitotic Index = 100 – 67.5 = 32.5% (8/20) + (10/20)/2 x 100 = 45% 1. What does your data indicate about the rate of cell division in cancerous tissue compared to the rate of cell division in normal tissue? What data did you use to answer this question? Cancer cells divide more rapidly and spend more time in mitosis. I used the mitotic index to come to this conclusion. 2. With what you have observed in this lab, if you were to compare tissue sample from normal breast tissue and cancerous breast tissue: a. Would you expect to see a difference in the rate of cell division in the cancerous breast tissue compared to the normal breast tissue? Explain your answer. I would expect that cancerous breast tissue has a higher rate of cell division than normal breast tissue because cancer cells have a higher mitotic index. b. Could you make a prediction about the average % dividing cells in the cancerous breast tissue? Explain your answer. Difficult to be exact but probably higher than 10% mitotic index since mitotic index of normal cells seems to be between 5-7.5%.

