Supplementary material S1
advertisement
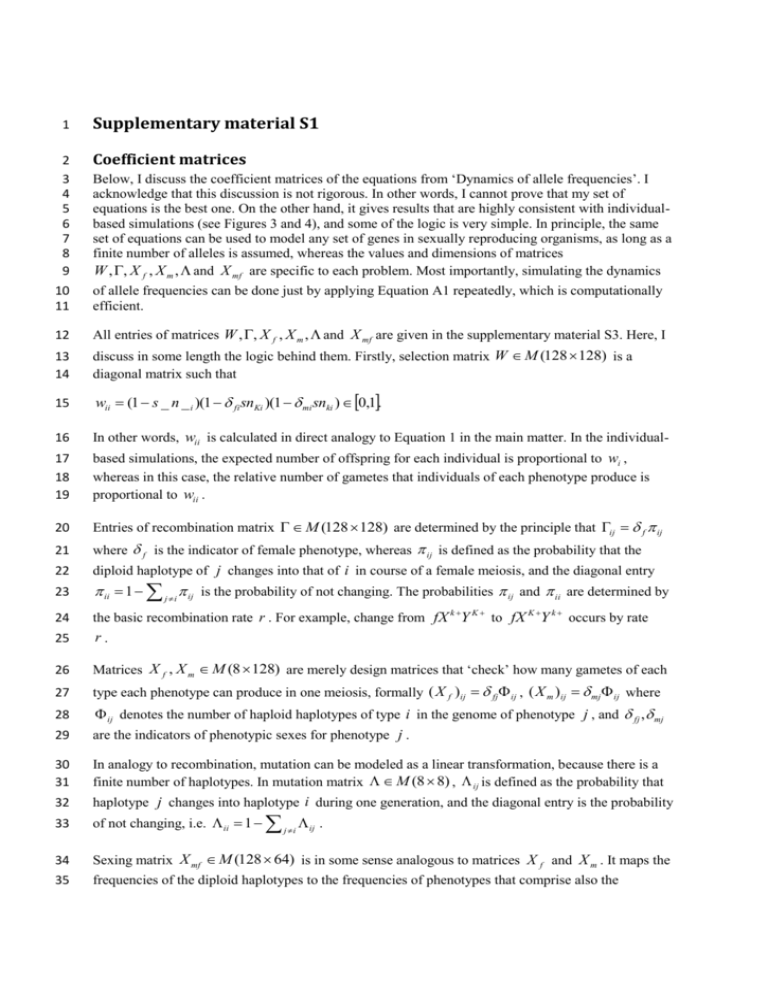
1 Supplementary material S1 2 3 4 5 6 7 8 9 Coefficient matrices Below, I discuss the coefficient matrices of the equations from ‘Dynamics of allele frequencies’. I acknowledge that this discussion is not rigorous. In other words, I cannot prove that my set of equations is the best one. On the other hand, it gives results that are highly consistent with individualbased simulations (see Figures 3 and 4), and some of the logic is very simple. In principle, the same set of equations can be used to model any set of genes in sexually reproducing organisms, as long as a finite number of alleles is assumed, whereas the values and dimensions of matrices W , , X f , X m , and X mf are specific to each problem. Most importantly, simulating the dynamics 10 11 of allele frequencies can be done just by applying Equation A1 repeatedly, which is computationally efficient. 12 All entries of matrices W , , X f , X m , and X mf are given in the supplementary material S3. Here, I 13 14 discuss in some length the logic behind them. Firstly, selection matrix W M (128 128) is a diagonal matrix such that 15 wii (1 s _ n _ i )(1 fi snKi )(1 mi snki ) 0,1. 16 In other words, wii is calculated in direct analogy to Equation 1 in the main matter. In the individual- 17 18 19 based simulations, the expected number of offspring for each individual is proportional to wi , whereas in this case, the relative number of gametes that individuals of each phenotype produce is proportional to wii . 20 Entries of recombination matrix M (128 128) are determined by the principle that ij f ij 21 where f is the indicator of female phenotype, whereas ij is defined as the probability that the 22 diploid haplotype of j changes into that of i in course of a female meiosis, and the diagonal entry 23 ii 1 j i ij is the probability of not changing. The probabilities ij and ii are determined by 24 the basic recombination rate r . For example, change from fX k Y K to fX K Y k occurs by rate 25 r. 26 Matrices X f , X m M (8 128) are merely design matrices that ‘check’ how many gametes of each 27 type each phenotype can produce in one meiosis, formally ( X f )ij fj ij , ( X m )ij mj ij where 28 29 ij denotes the number of haploid haplotypes of type i in the genome of phenotype j , and fj , mj are the indicators of phenotypic sexes for phenotype j . 30 31 In analogy to recombination, mutation can be modeled as a linear transformation, because there is a finite number of haplotypes. In mutation matrix M (8 8) , ij is defined as the probability that 32 haplotype j changes into haplotype i during one generation, and the diagonal entry is the probability 33 of not changing, i.e. ii 1 34 Sexing matrix X mf M (128 64) is in some sense analogous to matrices X f and X m . It maps the 35 frequencies of the diploid haplotypes to the frequencies of phenotypes that comprise also the j i ij . 36 phenotypic sex. Entries of X mf are given by the proportions of phenotypic females ( p.. f , p.. m ) and 37 the indicators of Y chromosome number ( 2 j , 1 j , 0 j ) in haplotype j , i.e. sex reversal is modeled 38 through matrix X mf : 39 ( X mf )ij fi ( p XXf 0 j p XYf 1 j pYYf 2 j ) mi ( p XXm 0 j p XYm1 j pYYm 2 j ). 40 Mapping c is defined as 41 c( P) : M (8 8) 0,1 such that 42 c 1 ( pi 8( j 1) ) pij . 43 44 It is merely a technical convenience that helps to avoid writing tensor equations. In summary, it holds that 45 64 pt 1 X mf c(X f Wpt pt'W '' X m' ' ) i1 pti 128 , ( Eq. A1) 46 47 the apostrophe denoting transpose of the respective matrix. This is the formula used by the R code in supplementary material S2. 48 49 50 Results of sensitivity analysis 51 52 interplay of sex reversal and the population dynamics of fecundity selection. Otherwise, the results are quite insensitive towards the assumptions made in the main matter. 53 Firstly, it was assumed in the main text that sex reversal is even between sexes so that In this section, I discuss results of the sensitivity analysis in more detail than it is feasible in the main matter. In general, it can be concluded that the selection differentials s and s _ are key to the 54 p XXm p XYf , which would be a fortunate special case in the wild. However, the results are not 55 56 very sensitive towards this assumption, as illustrated by Figure S1 where the dynamics of deleterious mutation is studied under two extreme scenarios. 57 Concerning the parameters in Table 1, the last two ones, n0 and r0 do not affect the qualitative results 58 in any way. However, a low value of n0 implies more demographic noise and a higher extinction risk, 59 60 both of which hinder observing the trends reported in the main matter. Likewise, too high (low) values of r0 hinder observing the effect of sex reversal, because they imply that the population is 61 always at the carrying capacity (or extinct), regardless the value of . 62 The rate of mutation affects the results only on a very long time scale, i.e. near mutation-selection 63 balance. The effects of s _ and r are illustrated in Figure S2. Intuitively thinking, a low value of s _ 64 65 (i.e., a low amount of Y chromosomal degeneration), and a low recombination rate r should make sex reversal less favourable. This is indeed observed for s _ in Figure S2A. It is presumable that also 66 in this case a low positive value of would be optimal, but that would be difficult to observe, 67 because the population is near the carrying capacity even without sex reversal ( 0 ). This is 68 understandable bearing in mind that r0 is now higher in relation to s _ , than in the baseline results. 69 70 The rate of sexual-antagonistic selection ( s ) operates analogously, but in the opposite direction than s _ . Concerning r , however, the results are unintuitive. In Figure S2B, 0.1 is even more 71 72 favourable than in the baseline scenario. This could stem from the fact that more sex reversal is needed to tap the advantage of purging Y chromosomes, if the rate of recombination is low. 73 Concerning the structural assumptions, the deletion of individuals above the carrying capacity 74 K 2n0 had no observable effect on the results. In the baseline results, individuals are deleted by 75 random until K is not exceeded. The effect of this mechanism was tested by deleting individuals by 76 probability proportional to their selection differential, i.e., by probability i 1 i . 77 78 79 80 81 82 83 84 85 86 Perhaps the most profound of the assumptions made in the main matter concerns the recombination matrix , and implicitly, the chromosomal organization. In the main matter, it is assumed that K / k and / are conditionally independent. Biologically, this implies that the physical organization of the sex chromosome is ( / , X / Y , K / k ) , or its mirror image. Two other combinations are possible, namely ( X / Y , / , K / k ) and ( X / Y , K / k , / ) . Results obtained under the other two combinations are illustrated by Figures S3-S5. Concerning summary statistics, dynamics resulting from the alternative combinations is surprisingly similar to the baseline case. (Compare Figures 1 and S3.) However, different chromosomal organizations induce different matrices which should show in the dynamics of the system in some way. According to Figure S4, the difference is mainly observed in the dynamics of a few male phenotypes. 87 88 89 90 91 92 93 94 Concerning coupling of the chromosomal organization and the population dynamics, the results are intuitively sound. In Figure S5, the effect of chromosomal organization is investigated by using the baseline parameter values and individual-based simulations with fecundity selection. It turns out that for ( X / Y , / , K / k ) , the advantage related to sex reversal shows slower than in the baseline case, but it is still observable. This was to be expected, because in this case, the deleterious mutation is in a closer linkage with the sex-determining locus than in the baseline case. Results for the chromosomal organization ( X / Y , K / k , / ) , however, resemble closely the baseline results presented in Figure 5.
