simulation lab 1: relating frequency and intensity to current
advertisement
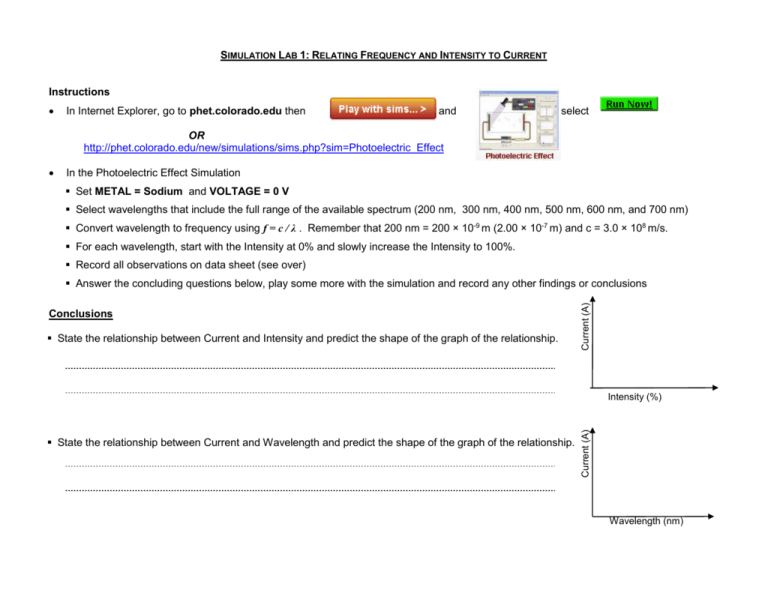
SIMULATION LAB 1: RELATING FREQUENCY AND INTENSITY TO CURRENT Instructions In Internet Explorer, go to phet.colorado.edu then and select OR http://phet.colorado.edu/new/simulations/sims.php?sim=Photoelectric_Effect In the Photoelectric Effect Simulation Set METAL = Sodium and VOLTAGE = 0 V Select wavelengths that include the full range of the available spectrum (200 nm, 300 nm, 400 nm, 500 nm, 600 nm, and 700 nm) Convert wavelength to frequency using f = c / λ . Remember that 200 nm = 200 × 10-9 m (2.00 × 10⁻⁷ m) and c = 3.0 × 10⁸ m/s. For each wavelength, start with the Intensity at 0% and slowly increase the Intensity to 100%. Record all observations on data sheet (see over) Conclusions State the relationship between Current and Intensity and predict the shape of the graph of the relationship. Current (A) Answer the concluding questions below, play some more with the simulation and record any other findings or conclusions State the relationship between Current and Wavelength and predict the shape of the graph of the relationship. Current (A) Intensity (%) Wavelength (nm) Raw Data Table 1. Wavelength (nm) Effect of changing the intensity of different wavelengths of light on the photoelectrons of sodium metal and the resulting current when the voltage is zero. Frequency (x 1014 Hz) 200 Colour Sodium Metal Minimum Effect of Increasing Intensity Intensity for Frequency of Speed of Photoelectrons Photoelectron Emission Photoelectrons (%) (faster/slower/no change) (faster/slower/no change) ultraviolet 300 400 500 600 700 Sample calculation for frequency from wavelength (use 200 nm). Other Findings / Conclusions: Maximum Current (A)
