Photoelectric Effect Virtual Lab
advertisement
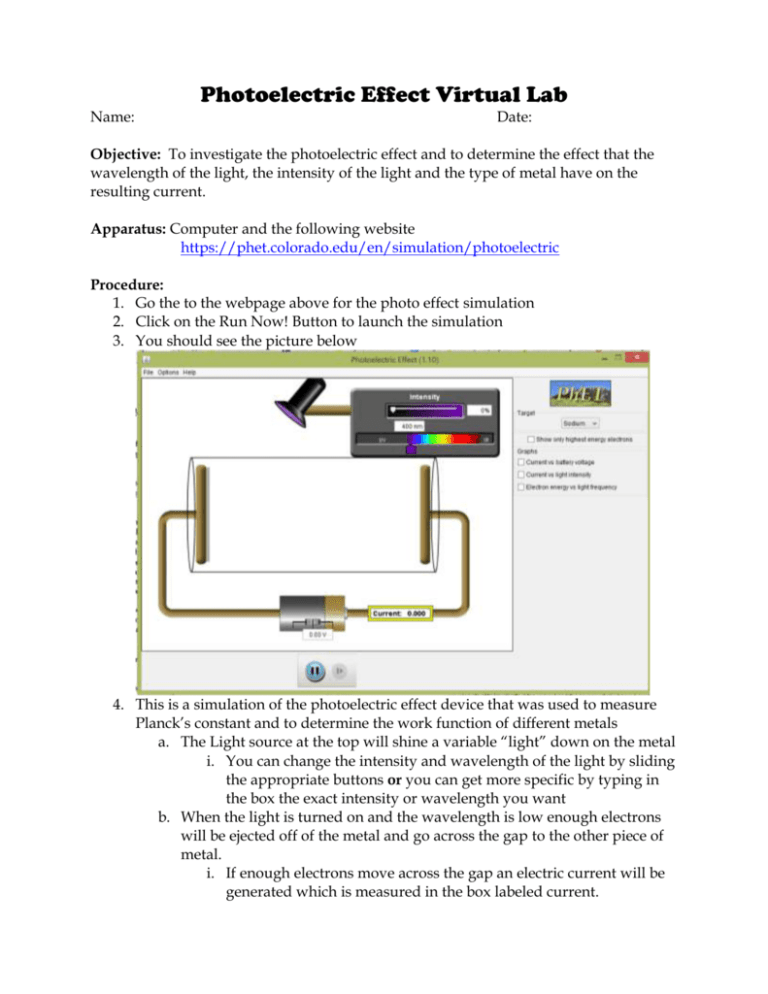
Photoelectric Effect Virtual Lab Name: Date: Objective: To investigate the photoelectric effect and to determine the effect that the wavelength of the light, the intensity of the light and the type of metal have on the resulting current. Apparatus: Computer and the following website https://phet.colorado.edu/en/simulation/photoelectric Procedure: 1. Go the to the webpage above for the photo effect simulation 2. Click on the Run Now! Button to launch the simulation 3. You should see the picture below 4. This is a simulation of the photoelectric effect device that was used to measure Planck’s constant and to determine the work function of different metals a. The Light source at the top will shine a variable “light” down on the metal i. You can change the intensity and wavelength of the light by sliding the appropriate buttons or you can get more specific by typing in the box the exact intensity or wavelength you want b. When the light is turned on and the wavelength is low enough electrons will be ejected off of the metal and go across the gap to the other piece of metal. i. If enough electrons move across the gap an electric current will be generated which is measured in the box labeled current. c. The battery is used to “stop” the electrons from flowing through the circuit and is called the stopping potential. i. It also provides a way to show the energy of the ejected electrons. ii. The energy of the ejected electrons will be the stopping potential (Voltage) times the charge of the electron (1.6*10-19 C) d. By adjusting the voltage of battery (either with the appropriate sliding button or by typing in an exact voltage) you can reduce the current back to zero after the photoelectric effect has begun and a current is measured. e. You can also change the metal that is being examined by changing the Target in the upper right hand corner. 5. Set the voltage to zero. This is the voltage across the gap so you can make it positive or negative to help or hinder the electrons moving across the gap. 6. Select Sodium as the metal and vary the wavelength until you observe a current a. This is shown by the bar at the top next to the metals 7. While you see a current vary the light intensity to see what affect this has on the current. 8. Repeat for two other metals. 9. Use your newfound knowledge of the applet to answer the following questions. Questions: Data Driven 1. Set the voltage to 0.0 V and the intensity to 100%. What is the smallest wavelength of light that can hit the metal and not produce a current? a. Sodium – b. Zinc – c. Copper – d. Platinum 2. Keep the voltage set at 0.0 V. Set the wavelength to 210 nm. Vary the intensity from 50% to 100%. What is the maximum current produced by the light for each metal? a. Sodium – b. Zinc – c. Copper – d. Platinum 3. Set the wavelength to 210 nm. Set the intensity of the light to 50%. Vary the voltage until there is no current. (This is called the stopping voltage). What is the voltage needed for each metal to stop the current flowing? a. Sodium – b. Zinc – c. Copper – d. Platinum Theory Driven (use the applet to confirm your answers) 4. When each metal is hit with light at the minimum wavelength (see question #1) can you vary the intensity of the light to start emitting electrons? a. 5. When each metal is hit with light below the minimum wavelength and you vary the intensity of light what is the relationship between the intensity and the current? a. 6. What does this (Ques 4&5) tell you about the intensity of light and how it affects the photo current? (Note: this is a 2 part answer) a. 7. Is there a relationship between the minimum wavelength and stopping voltage for the metals? If so, what is it? a. The final (real experiment)1. Select Sodium as your metal and set the light intensity at 50%. Set the light wavelength for the values below and determine the stopping potential (where current goes to zero) for each wavelength. 2. Enter values into Excel and use it to calculate the frequency of the incoming light and the KE of the ejected electrons in Joules. 3. Graph the KE vs. frequency and determine the slope of your graph. Data: Wavelength (nm) 436 400 365 300 254 200 150 125 Stopping potential (V) Calculations: Frequency (Hz) KE (of electrons) (J) (Copy and Paste Graph here) Graph Driven (use your graph to answer the questions below) 1. What is the slope of your graph? a. 2. What physical constant does this slope represent? a. 3. What is the %error of your slope? a. 4. What is the significance of the point where the plot crosses the x-axis? a. 5. What is the common name of this point? a. Conclusion:
