Russian_sensor_Ross-1_eng
advertisement

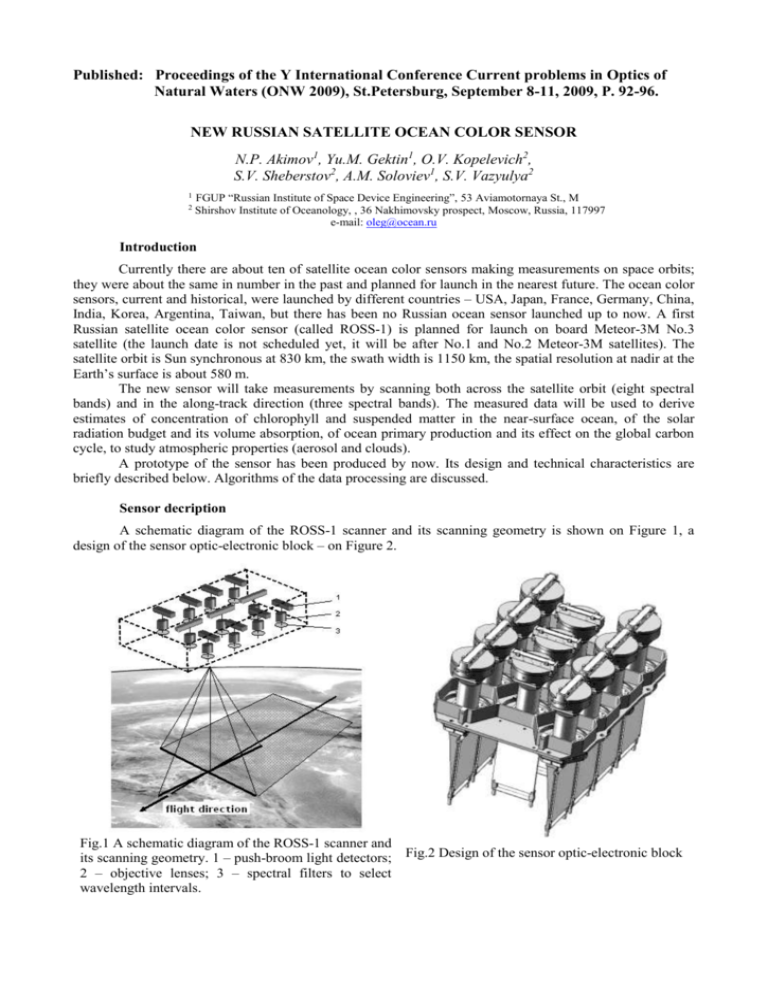
Published: Proceedings of the Y International Conference Current problems in Optics of Natural Waters (ONW 2009), St.Petersburg, September 8-11, 2009, P. 92-96. NEW RUSSIAN SATELLITE OCEAN COLOR SENSOR N.P. Akimov1, Yu.M. Gektin1, O.V. Kopelevich2, S.V. Sheberstov2, A.M. Soloviev1, S.V. Vazyulya2 1 2 FGUP “Russian Institute of Space Device Engineering”, 53 Aviamotornaya St., M Shirshov Institute of Oceanology, , 36 Nakhimovsky prospect, Moscow, Russia, 117997 e-mail: oleg@ocean.ru Introduction Currently there are about ten of satellite ocean color sensors making measurements on space orbits; they were about the same in number in the past and planned for launch in the nearest future. The ocean color sensors, current and historical, were launched by different countries – USA, Japan, France, Germany, China, India, Korea, Argentina, Taiwan, but there has been no Russian ocean sensor launched up to now. A first Russian satellite ocean color sensor (called ROSS-1) is planned for launch on board Meteor-3M No.3 satellite (the launch date is not scheduled yet, it will be after No.1 and No.2 Meteor-3M satellites). The satellite orbit is Sun synchronous at 830 km, the swath width is 1150 km, the spatial resolution at nadir at the Earth’s surface is about 580 m. The new sensor will take measurements by scanning both across the satellite orbit (eight spectral bands) and in the along-track direction (three spectral bands). The measured data will be used to derive estimates of concentration of chlorophyll and suspended matter in the near-surface ocean, of the solar radiation budget and its volume absorption, of ocean primary production and its effect on the global carbon cycle, to study atmospheric properties (aerosol and clouds). A prototype of the sensor has been produced by now. Its design and technical characteristics are briefly described below. Algorithms of the data processing are discussed. Sensor decription A schematic diagram of the ROSS-1 scanner and its scanning geometry is shown on Figure 1, a design of the sensor optic-electronic block – on Figure 2. Fig.1 A schematic diagram of the ROSS-1 scanner and its scanning geometry. 1 – push-broom light detectors; Fig.2 Design of the sensor optic-electronic block 2 – objective lenses; 3 – spectral filters to select wavelength intervals. The instrument forms images across the satellite orbit in eight spectral bands with the following band edges of the 50% response levels: 402-422, 433-453, 480-500, 500-520, 545-565, 660-680, 725-765, 845885 nm and along the orbit in three spectral bands: 433-453, 545-565, and 845-885 nm. As seen in Figure 1, 2, eleven identical optoelectronic systems are used; each includes a spectral filter to select wavelength intervals, an objective lens, and a push-broom light detector. The latter is a linear CCD array with 2048 elements. A focus length of the objective lens is 20 mm, a size of the each push-broom element is 14 x 14 ; the instantaneous field-of-view is equal to 0.7 x 0.7 mrad, the full field-of-view is 700. To select the required wavelength interval, the spectral filters designed in a new fashion are used. The filter is composed of the plano-convex and plano-concave lenses having spherical surfaces with the interference covering. The radius of curvature of the lenses is the same, and they form a system similar to a parallel-sided plate if they are cased towards each to other. Owing to such a construction, spectral characteristics of the filter are weakly dependent on the viewing angle. The additional filters of stained glass are used to cut off the secondary maxima of the interference filters; its application decreases the transmittance of the filter system out of the required wavelength interval down to 0.001-0. 005. Due to imperfection of the present technology of interference covering, changes of spectral characteristics of the filter with the viewing angle were found to be greater than the anticipated ones. Testing of the instrument has revealed the shift of the band edges under the large viewing angles: 7-8 nm for the angle of 350 (Fig.3) and 2-3 nm for the angle of 200. But there have been found no change in the band width. Fig.3 Spectral transmission of the instrument in the wavelength interval near 490 nm in the centre (W=00) and in the edges of the field of view (W=350). Physically the instrument has been built as a monoblock which sizes are 390 х 390 х 320 mm and weight is about 45 kg. Against external actions the protective lids are installed (Fig.2). For pre-launch characterization and calibration of the instrument the photometric bench is used. It has been certified by the Russian Institute of Standards as the reference device of 2nd category. The instrumentation provides characterization of the spectral characteristics, of linearity of the output signal, of the spread functions of the along-scan and along-track lines. Errors with the photometric bench are as follows: For the integral light source Absolute calibration error – 1.2%, Relative repeatability error – 0.5%; For the diffuse light source Absolute calibration error – 5.5%, Relative repeatability error – 0.2%; For the monochromatic light source Absolute calibration error – 5.8%, Error of the wavelength repeatability error – 0.5%. The in-flight control of the sensor stability will be performed with the onboard calibration set. It includes a pyrometric incandescent lamp energized by stabilized voltage. Approach to the data processing The integrated algorithm of the atmospheric correction uses data both from the across-track and along-track measurements. The data from along-track scanning (three spectral bands under the viewing angles from -350 to +350) are used to retrieve six unknown parameters at the sub-satellite point. These parameters are the water radiance reflectance at three spectral bands (443, 555, and 865 nm), two aerosol parameters, and wind speed (or the parameter of the distribution function of surface slopes). For next processing the latter is most important because it is used for computing the sun glint over a whole swath of the across-track scanning under assumption of homogeneity of wind speed within the swath. The other `parameters can be used for control comparison with the results of the across-track atmospheric correction. The algorithm of the along-track atmospheric correction is described in [1], the across-track atmosphere correction – in [2]. In the present paper some results of modeling with the integrated algorithm as compared with field data are shown. The northern part of the Caspian Sea was selected for modeling because there were available in situ data measured at several sea expeditions there. As a case with the pronounced sun glint, the satellite data of 29 June 2006 were taken (Figure 4). The field data were measured at three stations (C, L and R) which coordinates and the observation geometry (, 0 - the viewing and solar zenith angles, respectively; 0 – the azimuth angles) are given in Table 1; their location is shown on Fig.4. A trajectory of the new satellite was formed just over the station C (the time passing was 7:10 GMT); the station L was to the west in the area of a weak glint, the station R was to the east in the area of a strong glint (there the glint radiance reflectance was near 0.02; it is the highest value admissible for the atmospheric correction). The three selected stations are placed abreast; in Table 1 the values of the glint radiance reflectance at these stations (calculated with the wind speed of 6 m/s) are also given. The water optical parameters for stations C, L and R were measured at the real stations # 17 in 2004, # 5 and # 24 in 2008. The aerosol parameters were taken from the SeaDAS files of simultaneous satellite observations. The direct problem was solved by the modified method of discrete ordinate [3] using the values of water radiance reflectance , the aerosol parameters cac, caf [2], and the known observation geometry. Furthermore, for station C the direct problem was solved for a set of the viewing angles along the new satellite orbit (-35, -30, -25, -20, -15, 10, -5, 0, 5, 10, 15, 20, 25, 30, 35°). Fig.4 Simulated distribution of the glint coefficient that would be observed from the along-track scanning on 29 June 2006. Table 1 Coordinates of stations C, L and R; the observation geometry (, 0 - the sensor and solar zenith angles, respectively; 0 – the azimuth angles); the glint coefficient g calculated for these stations under the wind speed of 6m/s Station C L R North latitude 43.337 43.538 43.226 East longitude 50.011 48.557 50.756 pixel line 156 121 174 203 203 203 1.456 7.814 6.223 281.29 100.29 281.80 0 27.557 28.509 27.071 0 129.47 127.53 130.49 g 0.0100 0.0021 0.0175 At first the inverse problem was solved with data from the along-track scanning. The wind speed value retrieved was equal to 6.5 m/s (the given value was 6 m/s). Then the inverse problem was solved with data from the across-track scanning using the retrieved value of the wind speed of 6.5 m/s. The obtained results are given in Table 2 and on Figures 4A, B, C as compared with the value of wind speed of 4 m/s from a meteorological center. Table 2 Results of retrieval of spectral values of the water radiance reflectance ()102 from data of alongtrack scanning and across-track scanning as compared with the in situ measured data , nm 443 490 510 555 670 in situ 0.50 Station C 1.45 1.67 1.68 0.02 Along-track scanning 1.10 1.25 Across-track scanning with U=6.5 m/s 0.445 (-0.10) 1.26 (-0.13) 1.47 (-0.12) 1.42 (-0.155) 0 Across-track scanning with U=4 m/s 0.16 0.63 0.89 0.93 0.01 0.38 Station L 1.18 1.43 1.47 0.02 in situ Across-track scanning with U=6.5 m/s 0.41 (+0.09) 1.15 (-0.025) 1.35 (-0.06) 1.30 ((-0.12) 0 Across-track scanning with U=4 m/s 0.42 1.16 1.35 1.29 0 in situ 2.33 Station R 2.77 2.47 2.04 0.45 2.01 (-0.19) 1.39 1.76 (-0.14) 1.26 0.08 (-0.82) 0 Across-track scanning with U=6.5 m/s Across-track scanning with U=4 m/s Station C 1.08 (-0.54) 0.53 2.00 (-0.28) 1.25 Station R Station L Fig.4 Results of the atmospheric correction with simulated data of the TOA radiance for stations C, R, and L on Figure 3. 1 - measured spectral values of the water radiance reflectance (); 2 – the values of () derived with wind speed of 6.5 m/s; 3 – with the wind speed 4 m/s. Analyzing data from Table 2 and Figures 4A, B, C, we should compare the results for stations С and R with the results for station L. As seen from Fig.3 and Table 1, a glint at station L was weak, so the results for this station can be taken as the results of the atmospheric correction in the absence of glint. It is seen from Table 2, that errors in the wind speed for station L are of no practical importance, and the retrieval errors are quite acceptable (the maximum difference between the derived and in situ measured values of is equal to 1.7 10-3 at 555nm, and that difference is less than 10-3 at the other spectral bands. For station С the retrieval errors are also acceptable: the maximum error at the “right” wind speed value is equal to 2.6 10-3 at 555 nm, it is less than 2 10-3 at the other spectral bans. The errors are much greater with the “wrong” wind speed of 4 m/s: up to 8.2 10-3 at the spectral band of 490 nm. For station R, located in the area of strong glint, the retrieval errors are great; the maximum one at 412 nm is equal to 15.2 10-3. It is understandable because in such situation a great contribution to the TOA radiance arises from the sun glint, and the errors increase when doing its subtraction. Nevertheless, errors in the retrieval at the most important spectral bands of 510 and 555 nm (these data are used with the empirical algorithms to derive concentration of chlorophyll and suspended matter) are not so great to make impossible calculation of the above mentioned parameters. The ratio of 555/510 used to derive those parameters is equal to 0.83 with the in situ measured values of and to 0.88 with the calculated ones. It results in the error of chlorophyll concentration derived with the regression equation for the northern part of the Caspian Sea [4] equal to about 14%. Conclusion The study of possible processing of data from a new satellite sensor taking measurements by scanning both across the satellite orbit (eight spectral bands) and in the along-track direction (three spectral bands) has been done. The modeling, based on real field data in the northern part of the Caspian Sea, has shown that the integrated algorithm of the atmospheric correction using data both from the across-track and along-track measurements can give quite reasonable results. Acknowledgement. This research was supported by the grant OFI-C № 07-05-13555 from the Russian Foundation for Basic Research. References 1. 2. 3. 4. Sheberstov S.V., O.V. Kopelevich, E.A. Lukyanova., S.V. Vazyulya, Use of data from along-track scanning for atmospheric correction of satellite ocean color data // Proceedings of the V international conference “Current Problems in Optics of Natural Waters” St. Petersburg, 2009 (this issue). Kopelevich O.V., V.I. Burenkov, S.V. Sheberstov, A regional algorithm of the atmospheric correction of satellite ocean color data // Proceedings of the V international conference “Current Problems in Optics of Natural Waters” St. Petersburg, 2009 (this issue). Sheberstov S.V., Nabiullina M.V., Lukianova E.A. “Numerical modeling of radiative transfer in ocean-atmosphere system with wind-roughened surface” // Proceedings of the II international conference “Current Problems in Optics of Natural Waters” St. Petersburg, pp. 90 -95, 2003. Kopelevich O.V., V.I.Burenkov, S.V.Sheberstov, O.V.Prokhorenko, and S.V.Vazyulya, Continuation of the Long-Term series of Data in the Bio-Optical characteristics of the Russian Seas from Satellite Ocean Color Data // Proceedings of IV International Conference “Current Problems in Optics of Natural Waters (ONW’2007)”. Nizhny Novgorod. 2007. P. 75-78.


