COMPOSITE RATIOS
advertisement
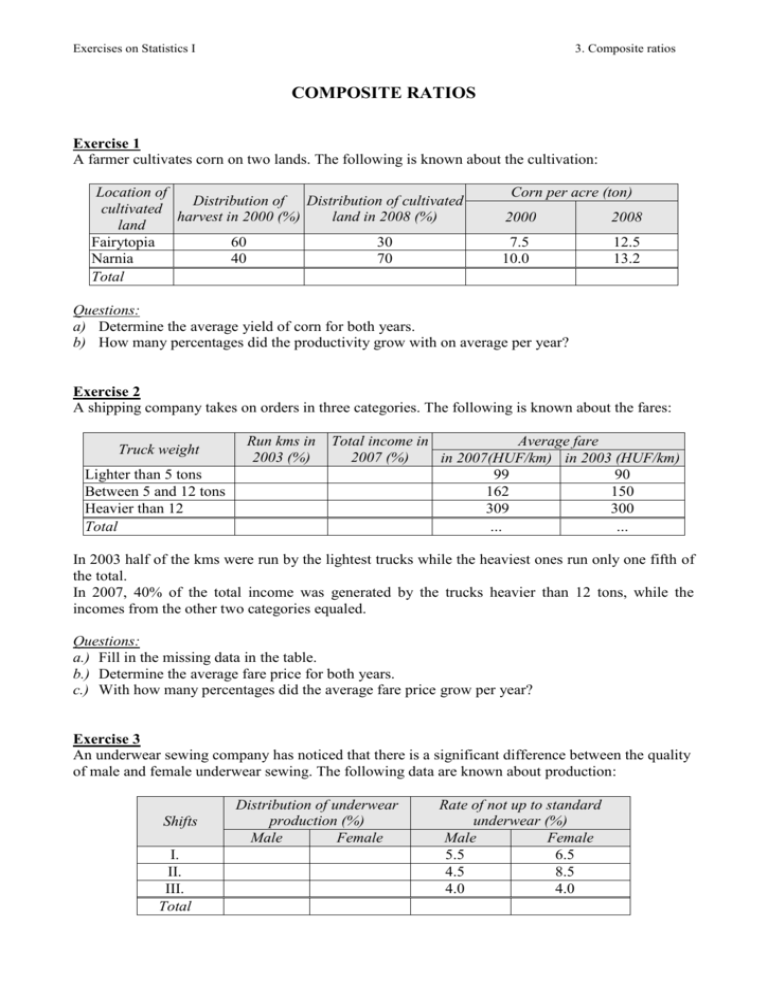
Exercises on Statistics I 3. Composite ratios COMPOSITE RATIOS Exercise 1 A farmer cultivates corn on two lands. The following is known about the cultivation: Location of Distribution of Distribution of cultivated cultivated harvest in 2000 (%) land in 2008 (%) land Fairytopia 60 30 Narnia 40 70 Total Corn per acre (ton) 2000 2008 7.5 10.0 12.5 13.2 Questions: a) Determine the average yield of corn for both years. b) How many percentages did the productivity grow with on average per year? Exercise 2 A shipping company takes on orders in three categories. The following is known about the fares: Truck weight Lighter than 5 tons Between 5 and 12 tons Heavier than 12 Total Run kms in 2003 (%) Total income in Average fare 2007 (%) in 2007(HUF/km) in 2003 (HUF/km) 99 90 162 150 309 300 … … In 2003 half of the kms were run by the lightest trucks while the heaviest ones run only one fifth of the total. In 2007, 40% of the total income was generated by the trucks heavier than 12 tons, while the incomes from the other two categories equaled. Questions: a.) Fill in the missing data in the table. b.) Determine the average fare price for both years. c.) With how many percentages did the average fare price grow per year? Exercise 3 An underwear sewing company has noticed that there is a significant difference between the quality of male and female underwear sewing. The following data are known about production: Shifts I. II. III. Total Distribution of underwear production (%) Male Female Rate of not up to standard underwear (%) Male Female 5.5 6.5 4.5 8.5 4.0 4.0 Exercises on Statistics I 3. Composite ratios They also know that 30% of the male underwear production came from the second shift while the 1st and the third shifts shared production equally. 20% of female underwear was sewed in the first shift while the third shift’s proportion equaled that of the male underwear. Questions: a) Fill in the gaps of the statistical table. b) Determine the average fare price for both types of underwear. c) Which factors influence the difference between the average rates of defectives? Exercise 4 A product of a manufacturing firm is produced in both of the plants of the firm, one in Budapest and the other in the countryside. The following data are known about the production. Plant Distribution of Production in production costs in 2007 (%) 2008 (%) Budapest Countryside Total Unit costs Change by 2008 In 2007 compared to 2007 (HUF/piece) (HUF) 2500 +400 2000 +400 … … In 2007 the plants shared production equally, while in 2008, production costs were 20% higher in Budapest. Questions: a.) Fill in the missing data in the table. b.) Determine the average fare price for both years. Exercise 5 A college library examined the library visiting habits of college students. The following was published: Year First Second Third Total Distribution of students in 2003 (%) … 30 25 … Number of borrowed books (books) in 2008 1 500 2 400 … 5 100 Number of borrowed books per student in 2003 in 2008 Change (book/head) (book/head) (2003 = 100 %) 5 … -40 8 6 … … … -20 … 4.25 … Questions: a.) Fill in all the missing data in the table. b.) Determine the average number of borrowed books in 2003. How many books did third year students borrow on average in 2007? c.) With how many percentages did the average number of borrowed books drop per year?

