2_synoptic_meteorolo..
advertisement
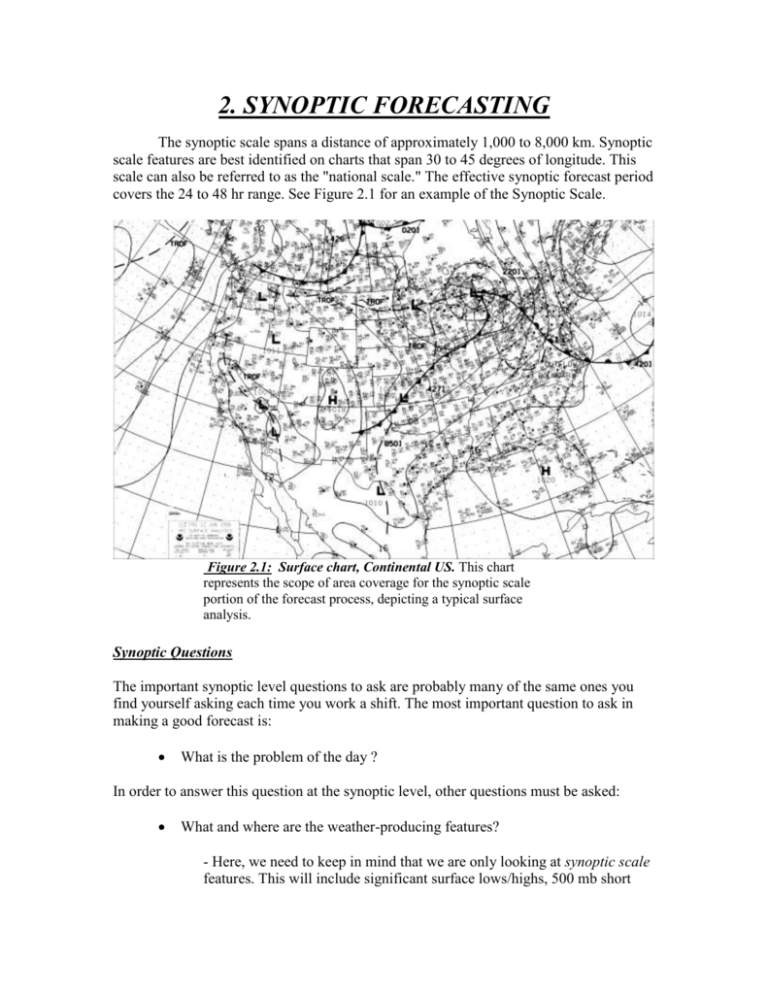
2. SYNOPTIC FORECASTING The synoptic scale spans a distance of approximately 1,000 to 8,000 km. Synoptic scale features are best identified on charts that span 30 to 45 degrees of longitude. This scale can also be referred to as the "national scale." The effective synoptic forecast period covers the 24 to 48 hr range. See Figure 2.1 for an example of the Synoptic Scale. Figure 2.1: Surface chart, Continental US. This chart represents the scope of area coverage for the synoptic scale portion of the forecast process, depicting a typical surface analysis. Synoptic Questions The important synoptic level questions to ask are probably many of the same ones you find yourself asking each time you work a shift. The most important question to ask in making a good forecast is: What is the problem of the day ? In order to answer this question at the synoptic level, other questions must be asked: What and where are the weather-producing features? - Here, we need to keep in mind that we are only looking at synoptic scale features. This will include significant surface lows/highs, 500 mb short wave troughs, motion of different air masses and associated fronts, along with other typical standard features that we are all well acquainted with. How well do the numerical models represent these features? - Does the model’s initial thickness pattern appear to match up well with our analyzed front? - Does the model detect obvious upper level features, like a comma-cloud shaped vorticity maximum? How are the different features going to evolve? - Here the idea is to set in our own mind how we expect a given feature to change based on our understanding of atmospheric dynamics, then match that up with the model output. Does the model seem to track features correctly in the short term? What about in the long term? Determining the Problem of the Day It is necessary to relate the various weather features to the large scale pattern and determine if they will affect your forecast area. After locating the features of concern, it is important to check the quality of the numerical models' initializations. This can be quickly accomplished by comparing satellite and other observation data with the initial panels of the model runs. Next, the evolution of the features of interest needs to be considered. Output from the numerical models, as well as the latest trends in the observations, are the main tools used to do this. Finally, armed with this information, the forecaster will likely have a good perspective of the general aspects of the problem or problems of the day. Synoptic Tools Tools useful for observing, analyzing, diagnosing, and forecasting at the synoptic scale are the ones that meteorologists have traditionally relied on the most. Some of the more important tools at this level include a mixture of old and new: Surface and Upper-Air Objective and Subjective Analyses; Cross-section Analyses Satellite Imagery Numerical Weather Prediction (NWP) Output Soundings Wind Profiler Data Lightning Data and Large Area Radar Summaries Analyses Because they provide meteorologists a means to quickly see weather patterns, objective and subjective analyses are useful tools when examining data. Reams of information are available in both the surface and upper air analyses of the actual observations (See figure 2.1). When time series of these products are examined, they provide an effective means for tracking the observed evolution of fronts, jets, cyclones and anticyclones. However, care must be taken to not assume that the details of the objective (NWP model) analyses are correct. Consulting satellite data in combination with these products leads to more informed use, often indicating that a partial reanalysis may be necessary. Analyzing areas of concern by hand is still a good idea, and can lead to further insight regarding the particular features of interest, and the accuracy of their representation in NWP guidance. A number of good practices still includes, for example, a hand-drawn 850 temperature analysis. Comparing this to the model’s version of the 850 mb temperatures will reveal any potential warm/cold biases in the model. This may be due to a number of reasons, including: Poor model initialization Difficulties with the physical packages (such as flux rates, latent and sensible heat, etc.) Problems at the production facility (forcing execution of the model in a degraded mode). Another good technique is to use computer systems to display observed reports (like PIREPs), and overlay model parameters on top. One application is to show surface reports against mean sea level pressure (MSLP). Another would be to show wind reports from PIREPS (let’s say between 30,000 and 40,000 feet) over 250 mb model isotachs and heights to validate the strength and direction of the jet stream. It is recommended that a typical forecast should include an analysis of the items listed below. This may consist of a simple comparison of plotted observations to model output, rather than a detailed manual analysis. It would be nearly impossible to complete a full manual analysis of the items listed below. Use computer products on the internet and via other sources to compare model output to actual observations, in order to determine the correctness of the models initial state (See Figure 2.2 for an example of this type of product). Tropopause/Jet Stream level analysis. This is a 300 mb, 250 mb, or 200 mb analysis, depending on where you are forecasting in the world. We expect that most units will need to use 300 mb most of the time (Figure 2.2). 250 mb and 200 mb tends to be a better level for subtropical and tropical regions. On this analysis, include: 1. Isopleths of geopotential height 2. Jet axes (50 kt or greater) 3. Long-wave troughs and ridges Figure 2.2: 300 mb chart, North America. This chart represents the type of products a forecaster needs on the upper air portion of the forecast process, depicting a typical Jet Stream level analysis. Notice how the actual radiosonde data is plotted along with isotachs and the isopleths of geopotential height (all from the ETA model). This facilitates quick and easy comparison of actual data to model output. 500 mb analysis 1. Isopleths of geopotential height 2. Jet axes (50 kt or greater usually, though try 40 kts in summer) 3. Major troughs and ridges 4. Short wave troughs and vorticity maxima (both positive and negative vorticity advection) 5. Isotherms 6. Areas of high moisture/relative humidity 7. Regions of moisture contrast (dry vs. moist) 925 mb , 850 mb, and 700 mb analysis: 1. Isopleths of geopotential height 2. Isotherms 3. Isodrosotherms (Dew Point Isopleths) at 925 and 850 mb 4. Areas of high moisture/relative humidity 5. Regions of moisture contrast (dry vs. moist) 6. For 850 mb, identify any low level jets (30 kt or greater) Surface analysis: 1. Fronts, troughs, and confluent zones. 2. Pressure centers and pressure value 3. Dry lines / Squall lines 4. Bubble highs/outflow boundaries 5. Moisture Ridges 6. Thermal ridges 7. Axis of maximum moisture advection 8. Regions of thermal advection 9. Isallobars (surface pressure rises/falls – exists on the web) 10. Significant tropical features (if applicable), such as tropical cyclone formation alert (TCFA) areas, tropical depressions, tropical storms, hurricanes/typhoons. Looking at surfaces of constant potential temperature (theta) is an excellent way to represent the true three dimensionality of the atmosphere. Unlike isobaric surfaces, which usually represent a nearly constant altitude, isentropic surfaces can slope greatly! Since many atmospheric processes are approximately adiabatic, isentropic surfaces can act as material surfaces making it easier to infer 3-D motions. For more information on the use of isentropic products, please refer to AWS TN-87/002, “Isentropic Analysis and Interpretation” (See the reference section in the back of this publication). Cross-sections provide a superior means to assimilate data in the vertical. Weather features of interest can fall between the cracks of standard constant pressure and isentropic surfaces, but do appear in a coherent manner in vertical cross-section analyses. Satellite Imagery Using animated satellite imagery is an efficient way to quickly locate the "weathermakers", and to obtain an initial “feel” for the intensity trends of individual weather systems. Satellite data can also have an important role in the verification of model analyses and prognoses. By examining satellite imagery, a meteorologist can determine if features of concern are located properly and/or propagating and developing at the rate predicted by the models. If one compares Figure 2.3, a visual satellite image over the western Pacific, with model output, then similarities and differences will be observed. Figure 2.4 shows a short term, 2-dimensional (2-D) cloud forecast product from AFWA’s version on the 36 km MM5 window centered over Korea and Japan. Notice how the model picks up nicely on the multi-layered clouds over Manchuria and North Korea, and with the large low pressure system just to the east of Japan. The developing clouds over southern Shanxi province of China (due west of Peking) are depicted with reasonable success by the MM5, though the high cirrus and mid-level clouds over the Yellow Sea are not evident on MM5. Overall, though, we see the model detecting major systems of clouds with some reasonable degree of accuracy. Figure 2.3: Satellite imagery, Western Pacific. This image is used in conjunction with the MM5 2-dimensional cloud forecast product (Figure 2.4) to compare and validate the model’s initial state with reality. Figure 2.4: MM5 2-dimensional cloud product, Western Pacific. This image is used in conjunction with the visual and infrared METSAT imagery (as in Figure 2.3) to compare and validate the model’s initial state with reality. NWP Output Since the equations of motion cannot be integrated manually, forecasters rely heavily on numerical models to determine the future state of the atmosphere. Now, and even more so in the future, meteorologists will have improved, sophisticated numerical models at their disposal. Numerical models usually produce reasonably accurate forecasts of the large scale features of the atmosphere. Longer range forecasting, beyond 48 hours, is generally handled well enough by NWP to allow the meteorologist more time to assess smaller scale phenomena relevant to the short term forecast. However, there will always be a need to understand NWP and its limitations, and to know how to verify the model initialization and adjust model output accordingly. It should never be considered acceptable to use NWP blindly. Soundings Since their inception into routine meteorological observations, upper air soundings have been one of the primary tools providing synoptic scale (and mesoscale) meteorological observations above the surface. A few of the areas where soundings are helpful when used individually include: locating fronts, determining static stability, assessing the level of the tropopause, and determining vertical wind shear. Collectively, their input is used to produce both the constant pressure and isentropic analyses. Either way, sounding data continues to be an invaluable meteorological data source. “Sounding data” can come in a number of different formats. The most common form is the Skew-T , Log-P diagram, as in Figure 2.5, for Topeka, Kansas. However, we should use this data (at the synoptic scale) to produce large scale maps of upper air features across near continental scale regions, such as Figure 2.2. Of course, the Skew-T diagram is also very useful for mesoscale analysis, but let’s save that discussion for section 3. Figure 2.5: Skew-T diagram, Topeka, Kansas. This data is used (among many applications) to construct synoptic scale charts of upper air map across the Continental United States. There is still some other synoptic scale information we can derive from the soundings , such as stability. We can take observed values of stability parameters, such as the Lifted Index (LI), or K-Index (KI), and plot them on a synoptic scale map, such as in Figure 2.5. This product can then be used in conjunction with model data to compare the NWP Figure 2.5: Lifted Index and K-Index Analysis, Continental US. This data is constructed from numerous radiosonde observations from across the Continental United States to provide knowledge of actual instability in the atmosphere. models instability with reality. Compare Figure 2.6 with Figure 2.7, which is a six hour forecast of lifted index from the AFWA MM5. You will see some strong similarities across the majority of the continental US. Overall, the MM5 did a reasonable job of depicting areas of instability. There is a difference between the observed LI and the forecast version over eastern Nebraska and South Dakota, extending into Minnesota. For example, the actual LI is 4 in Minneapolis, whereas the MM5 seems to indicate –4 to –6. One might conclude that the model is slightly overestimating the size of this unstable area. Otherwise, the MM5 did a super job, overall. Figure 2.7: AFWA MM5 6 hour Lifted Index forecast, Continental US. This product can be compared with Figure 2.6, so that the forecaster may quickly compare actual atmospheric instability with the model estimate. Wind Profiler Data The best aspect of the wind profiler is its ability to provide extremely useful wind observations, at hourly intervals, in both the troposphere and the lower stratosphere. When data from multiple profilers are examined on an x-y plane at a given pressure level, the wind information between the sounding balloon launch times can greatly aid the tracking of transient weather features important to understanding the current state of the atmosphere. Lightning Data and Large Area Radar Summaries Lightning reports and consolidated depiction’s of echoes from multiple radars are helpful in calling attention to areas that need to be studied in more detail. Especially noteworthy are those times when lightning and radar echoes are reported during the early morning hours. This indicates that the convection is caused by dynamic forces that should be investigated. Synoptic Conceptual Models The pool of conceptual models, upon which meteorologists rely, is primarily composed of concepts relating to synoptic scale phenomena. Some of the more important models include: Geostrophic Theory Relationships Frontal Models Upper-Level Jet Structure The Baroclinic Leaf (as observed in satellite) Geostrophic Theory Relationships Developed by theoreticians, but based on observations, geostrophic theory is probably the best application of dynamics to synoptic meteorology. After making several assumptions, it can be shown that above the ground, where the effects of friction are negligible, the coriolis and pressure gradient forces are nearly balanced. Therefore, the atmosphere is nearly geostrophic, (sometimes this is called quasi-geostrophic). The equations that deal with vorticity (in a geostrophic situation) and thermodynamic parameters give forecasters the ability to understand the physical processes at work in midlatitude synoptic scale weather systems. These equations, or relationships, eliminate meteorologically insignificant wave motions in order to better isolate synoptic scale phenomena. Frontal Models Frontal classifications include: cold fronts, warm fronts, stationary fronts, and occluded fronts. Further subdivisions of frontal types include: anafronts, katafronts, split fronts, and labels referring to the level where they occur in the atmosphere. Occluded fronts can be either warm or cold type occlusions. The conceptual models of these frontal types lay the foundation for many of the phenomena forecasters encounter daily. Upper-Level Jet Structure Due to their nature as narrow regions of strong flow in the upper atmosphere, jets play important roles in both horizontal and vertical motions in the atmosphere. Both the polarfront jet and the sub-tropical jet impact forecasting in midlatitudes. Local isotach maxima imbedded in the upper level flow are referred to as "jet streaks." Straight jet streaks are associated with a four cell pattern of vertical motion, whereas curved jet streaks exhibit more of a two cell ascent/descent pattern. Jet streak conceptual models are important in forecasting phenomena as diverse as severe convection and cyclogenesis. Baroclinic Leaf A more focused model than some of the ones mentioned above is that of the baroclinic leaf . This phenomenon, when observed as a low amplitude "S" shape in the clouds or water vapor satellite imagery, should conjure up a conceptual model of the dynamics that are responsible for its formation. Baroclinic leaves are usually associated with significant cyclogenesis.
