Radiography with Visible Light
advertisement
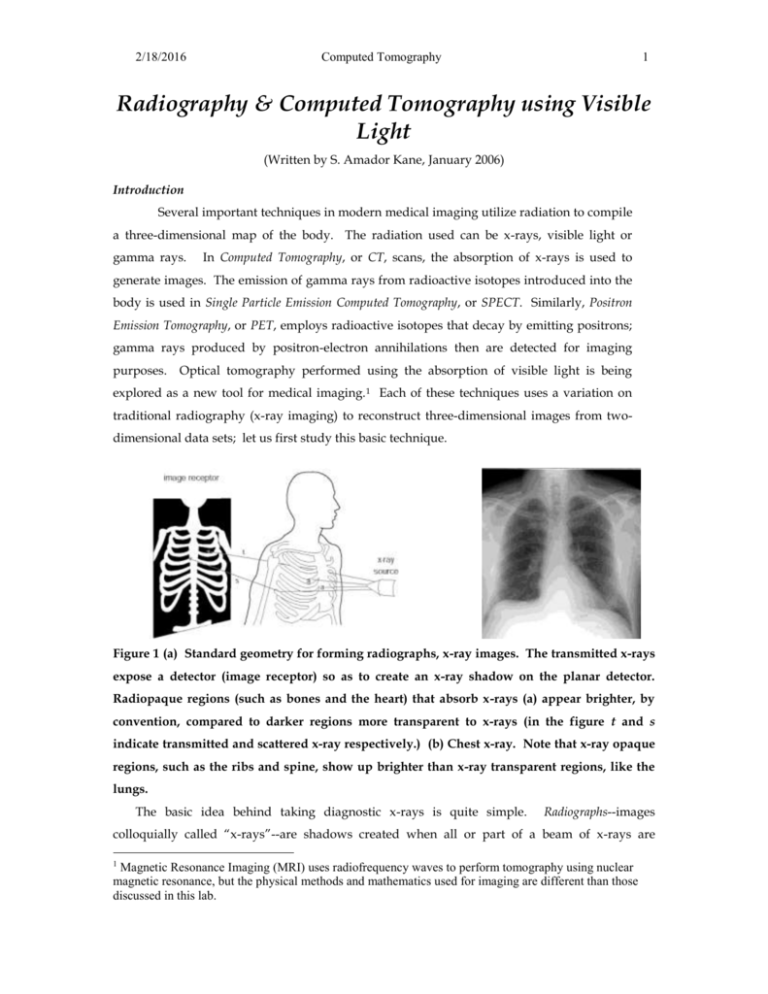
2/18/2016 Computed Tomography 1 Radiography & Computed Tomography using Visible Light (Written by S. Amador Kane, January 2006) Introduction Several important techniques in modern medical imaging utilize radiation to compile a three-dimensional map of the body. The radiation used can be x-rays, visible light or gamma rays. In Computed Tomography, or CT, scans, the absorption of x-rays is used to generate images. The emission of gamma rays from radioactive isotopes introduced into the body is used in Single Particle Emission Computed Tomography, or SPECT. Similarly, Positron Emission Tomography, or PET, employs radioactive isotopes that decay by emitting positrons; gamma rays produced by positron-electron annihilations then are detected for imaging purposes. Optical tomography performed using the absorption of visible light is being explored as a new tool for medical imaging. 1 Each of these techniques uses a variation on traditional radiography (x-ray imaging) to reconstruct three-dimensional images from twodimensional data sets; let us first study this basic technique. Figure 1 (a) Standard geometry for forming radiographs, x-ray images. The transmitted x-rays expose a detector (image receptor) so as to create an x-ray shadow on the planar detector. Radiopaque regions (such as bones and the heart) that absorb x-rays (a) appear brighter, by convention, compared to darker regions more transparent to x-rays (in the figure t and s indicate transmitted and scattered x-ray respectively.) (b) Chest x-ray. Note that x-ray opaque regions, such as the ribs and spine, show up brighter than x-ray transparent regions, like the lungs. The basic idea behind taking diagnostic x-rays is quite simple. Radiographs--images colloquially called “x-rays”--are shadows created when all or part of a beam of x-rays are 1 Magnetic Resonance Imaging (MRI) uses radiofrequency waves to perform tomography using nuclear magnetic resonance, but the physical methods and mathematics used for imaging are different than those discussed in this lab. 2/18/2016 Computed Tomography 2 absorbed by a part of the body (such as the skeleton) (see Fig. 1(a)). The source of x-rays is generally a device called an x-ray tube, which emits x-rays at many different angles. The person being examined lies between the x-ray source and the detector, or image receptor. The geometry for formation of images is now apparent: a particular point on the detector corresponds to one pathway x-rays can take through the body. Each individual x-ray can be transmitted, absorbed or scattered along each pathway. The image receptor measures the total number of x-rays transmitted through the part of the body in a line of sight between the source and that part of the detector, plus any scattered x-rays. In images such as Fig. 5-1(b), the brighter regions correspond to fewer x-rays hitting the image receptor (radiopaque regions), and the darker regions indicate where more x-rays hit the image receptor (x-ray transparent or radiolucent regions). This is surprising to most people, since it is natural to think that the brighter regions on an image correspond to more radiation. The resulting image is a projection (or shadow) of all of the radiopaque objects in the x-ray's path. Since there is no way to detect whether one object was in front of or behind another, the two overlap on the projected image. This means that diagnostic x-rays inherently lose depth information, and provide only a flattened planar image of the body (Fig. 1(b)). Variations in x-ray absorption along different pathways in the body are the essential quantity influencing image formation. Therefore, to understand x-ray image formation, we first address ways to understand how body tissues differ in their abilities to absorb x-rays. The exact mathematical expression for the intensity, Itrans, of single energy, single wavelength x-rays transmitted by a material of thickness x is given by: I trans = I o e x Eq. (1) where Io is the intensity of x-rays incident upon the absorber and is a quantity called the attenuation coefficient. The attenuation coefficient varies depending upon the x-ray energy and the elemental makeup of the absorbing medium. While it is usually determined experimentally, it can also be explained in terms of the chemical makeup of the tissues of interest. In particular, different body tissues (muscle, fat, blood, etc.) have different attenuation coefficients for different x-ray energies. We can compute the intensity transmitted through two or more consecutive regions with thicknesses x1, x2, x3, x4, etc. and attenuation coefficients 1, 2, 3, 4, etc. respectively. Since each diminishes the transmitted intensity by a factor given by Eq. (1), we repeatedly multiply the initial intensity by the correct factor for each region: I trans = Io e 1 x1 e 2 x2 e 3 x3 e 4 x4 etc. Io e 1 x12 x2 3 x3 4 x4 ... Eq. (2) 2/18/2016 Computed Tomography 3 The exponents simply add, yielding a relatively simple expression for the absorption due to multiple layers. Sample calculation: Let us compute some typical numbers for the x-ray transmissions encountered in a chest x-ray. First, how many x-rays are transmitted through a region of soft tissue (muscle, fat, skin, etc.) approximately 20 cm thick? We can use this to model the transmission through the upper chest for a small person. For 20 keV x-rays, the linear attenuation coefficient, = 0.77 cm-1 for soft tissue. I trans =e Io x e 0 . 77 cm 1 20 cm 2.1 10 7 Eq. (3) This means virtually none of the x-rays are transmitted at 20 keV, making this choice of photon energy a poor one for chest x-rays—the patient would absorb virtually all of the x-rays, leaving almost none to form the image! For 60 keV x-rays, the linear attenuation coefficient is very different, = 0.21 cm-1, so we have instead: I trans =e Io x e 0 . 21cm 1 20 cm 1.5 10 2 Eq. (4) This is still a small percentage of the original x-ray intensity: only 1.5% of the incident x-rays are transmitted. This is adequate to form an x-ray image at an acceptable x-ray dose. Higher energy photons are used to image thicker body sections, as in chest x-rays, because of this dramatic difference in transmission. Increasing the x-ray energy would result in yet more transmission, but the difference in linear attenuation coefficients between different body tissues is negligible for higher x-ray energies. The difference in the x-ray transmission between two regions is called the contrast. If two different tissues have identical x-ray absorption properties, then they are indistinguishable in a radiograph. Thus, higher energy x-rays are transmitted better by the body, which is good because more x-rays hit the detector rather than being absorbed by body tissues. However, higher energy x-rays offer poorer contrast between body tissues, which is undesirable for imaging. Modeling Radiography with Visible Light First, you will do a simplified experiment illustrating some basic principles of radiography, but using visible light rather than x-rays. You will be casting shadows on a wall, rather than capturing images on x-ray film, but otherwise the principles of x-ray image formation are very similar to your exercises here. You will image phantoms, simple models that reproduce the issues found in medical image formation, rather than actual parts of the body. You will examine several basic concepts important throughout medical imaging: magnification (the ratio between the size of an image and size of the object being imaged); contrast (the difference in x-ray absorption of two parts of the object being imaged); and blur, or spatial resolution, (the smallest 2/18/2016 Computed Tomography 4 size feature that can be distinguished in the image.) You will see how these factors depend upon imaging geometry (source size, the distances in the imaging experiment, etc.), the properties of the object being imaged, and the image receptor. First, note that your two radiation sources are ordinary white light lamps. You will use these rather than x-ray tubes in today’s lab, but they resemble x-ray tubes in that they have a variety of sizes of the light-emitting source and that they emit radiation in a wide range of angles. Each lamp has a lightbulb with the same power rating (60 or 100 watts in each case), but the bulbs differ in one respect: one bulb has clear glass and the other frosted white glass surrounding the central light-emitting filament. As a result, the bulb with clear glass emits light from the bright filament itself. The light source is very small as a result. Turn it on now and look at this effect; use your ruler to estimate how wide across the bright filament is. (We will use this source size later in your image formation calculations.) Now, turn on the lamp with the frosted bulb. Notice how the white glass surface diffuses the light so it seems to be coming from the entire globe of the light bulb. You cannot see the filament inside, so this lamp acts like a large radiation source the size of the entire light bulb. Measure and record the effective size of this large radiation source for use later. Place your two lamps so their light bulbs are each 1 meter away from the wall. You are now ready to form some images. You have been provided with several transparent pieces of plastic with patterns like the ones in Fig. 2. Rather than a real patient, you will image what is called a phantom in medicine. (This term is used to refer to a device used in the laboratory to stand in for the patient when testing out and calibrating imaging equipment.) These sheets of patterned plastic will be stacked up to make phantoms that model various scenarios of interest. (a) (b) (c) 2/18/2016 Computed Tomography (d) 5 (e) Figure 2 Sample patterns to use in model radiography experiment. The objects on the phantom image are meant as models of situations encountered in x-ray imaging. The two largest gray circles at left are meant to model the absorption of x-rays by a thick body section being imaged. For a chest x-ray, this would be a model of the soft tissues in the chest; for a mammogram, it models the absorption due to the entire breast. In (c), the smaller, darker circles represent the tissues of interest to be imaged. For example, the three black circles in a row might be radiopaque bones, or microcalcifications (tiny, mineralized deposits) in a breast tumor. The larger, dark gray circles might stand in for a region of denser soft tissue (like the heart in a chest x-ray) or a tumor in a mammogram. You can see by inspection that there are two ways in which the black circles and the gray circle differ: they vary in size and in contrast—the difference in their light-absorbing properties. Let us explore how these differences in size and contrast influence how they can be imaged in radiography. 1) Place the image Fig 2(a) and (c) on top of each other to form the combined image shown in Fig. 2(d) and place them close to the wall. We will call this combination phantom 1. Use your two light sources to create a projection (shadow) image, taking turns using each source one at a time. If you keep phantom 1 about a centimeter away from the wall, can you see clear shadows of all of the structures easily? Which objects are easier to see clearly? Comment on how the size and light-absorption of the different absorbing circles makes it easier or more difficult to see each object on the projected image. Relate to the contrast of the objects on the projected image. 2) Now, keep the lamps at the same position relative to the wall, but try moving the phantom farther from the wall, and closer to the wall. What do you notice about the images of each absorber as you move them closer and further from the wall? Record your observations and try to explain why you see these effects. Note in particular which objects become harder or easier to visualize as you change their position, and how this relates to the contrast and blurring of the image. Comment in particular how many of the small black circles you can visualize at varying distances; the smallest size image distinguishable sets the spatial resolution. The blurred regions around each object’s shadow are called penumbra (or penumbrum for singular). Notice and sketch where you see a one of these forming around the image. (Refer to Fig. 3(a). Your phantom is the “object” being imaged here.) Comment on how the appearance of the penumbrum depends upon the geometry for image formation, and explain its origin. Use these ideas to explain which geometry gives you the best spatial resolution. 3) Now, we will look at the effect of an image receptor. To do this, we will use a sheet of luminescence plastic. (This material stores light energy when it is irradiated, then re- 2/18/2016 Computed Tomography 6 emits the light. Thus, the luminescent sheet acts like an image receptor that can capture an image of a formed shadow, similar to the operation of a fluorescent screen in radiography.) Using your imaging geometry from part 2) above and form the same image on the wall and on the luminescent screen. Comment on the effects on blur and contrast of using each imaging setup. 4) Now repeated parts 1) and 2) above, but using phantom 2 (formed from Fig. 2(b) and (c), as shown in Fig. 2(d)). Explain how and why your answers differ between the two phantoms. (The comparison between phantoms 1 and 2 models the different challenges in performing mammography on older and younger women, respectively. When women are past child-bearing age, their milk gland tissue shrinks, leaving behind breast tissue with a higher proportion of fat. Thus, younger women have denser breasts compared to older women. Just as the contrast between the objects and the background is greater for phantom 1, older women’s breasts have less x-ray absorption than solid tumors or microcalcifications. As with phantom 2, younger women are harder to image because of reduced contrast between their denser breast tissue and tumors.) 5) The magnification, M, for this geometry is defined as the ratio of the size of the image, I, to the size of the original object, O. (See Fig. 3(b) for the relevant geometry.) M=I/O Eq. (5) For a very tiny source size, we can derive this ratio using the similar triangles formed by (1) the source, S, and the sides of the object and (2) the source, S, and the sides of the image. This implies that: O/ d1 = I/( d1 + d2) Eq. (6) From which we can derive the magnification using Eq. (5) and (6): M = (d1 + d2)/d1= 1 + (d2/d1) Eq. (7) Using the smaller source size, check out the dependence of this model for different values of the two distances for d2= d1, d2 >> d1 (where M d2/d1) and d1 >> d2 (where M 1). How well does it describe your actual imaging system? 6) Now, have your lab partner make up a new phantom consisting of two copies of Fig. 2(c) laid on top of each other, combined with either (a) or (b). Now, you should look at the projection only and try to describe what the phantom looks like in detail. Can you tell in which order the overlapping absorbers were assembled? Trade places and repeat. Explain why this three dimensional information is lost in projections (and how you might use a projection to discover it!) 2/18/2016 Computed Tomography (a) Figure 3. (a) Illustration of geometry for penumbra formation. 7 (b) (b) Geometry for understanding magnification of an object relative to its image. Exercises on Subtraction Radiography and Computed Tomography are under development and will be posted on the web within the next academic year.
