Part 3
advertisement
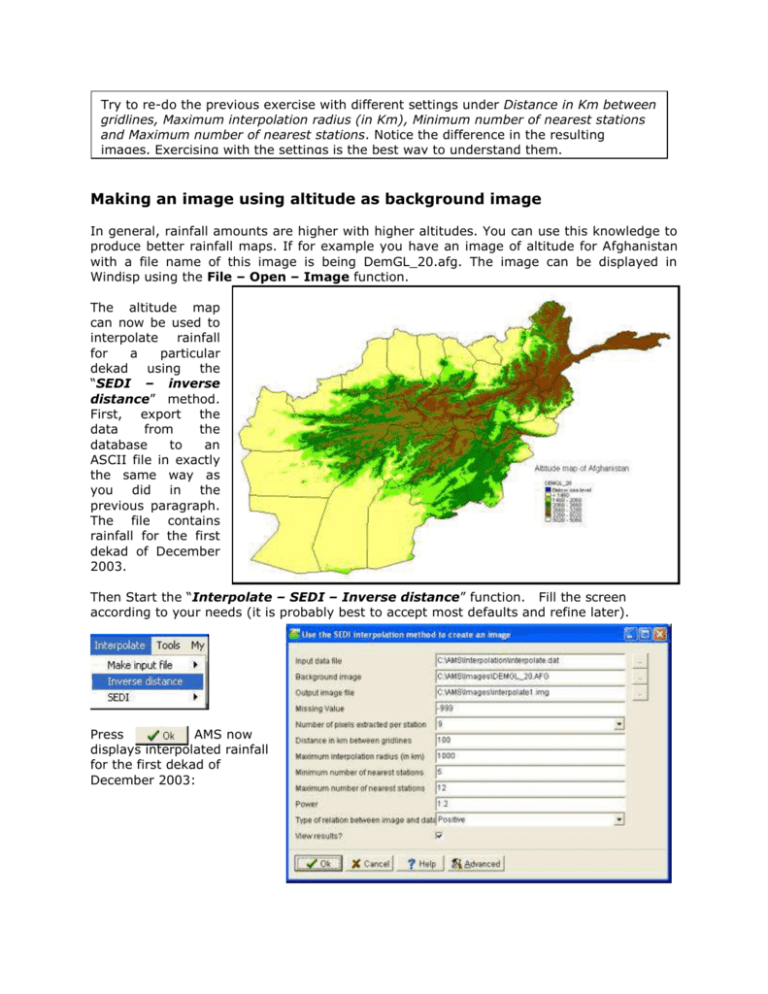
Try to re-do the previous exercise with different settings under Distance in Km between gridlines, Maximum interpolation radius (in Km), Minimum number of nearest stations and Maximum number of nearest stations. Notice the difference in the resulting images. Exercising with the settings is the best way to understand them. Making an image using altitude as background image In general, rainfall amounts are higher with higher altitudes. You can use this knowledge to produce better rainfall maps. If for example you have an image of altitude for Afghanistan with a file name of this image is being DemGL_20.afg. The image can be displayed in Windisp using the File – Open – Image function. The altitude map can now be used to interpolate rainfall for a particular dekad using the “SEDI – inverse distance” method. First, export the data from the database to an ASCII file in exactly the same way as you did in the previous paragraph. The file contains rainfall for the first dekad of December 2003. Then Start the “Interpolate – SEDI – Inverse distance” function. Fill the screen according to your needs (it is probably best to accept most defaults and refine later). Press . AMS now displays interpolated rainfall for the first dekad of December 2003: The details of all settings will not be explained here. The created image is compatible with Windisp. After that you can now view the map in Windisp using a new colour table and create a nice map for input into a bulletin. The map can then be labeled as shown in figure: AgroMetShell Manual, August 2004 1 Making an interpolated image with data for a whole season The AMS option you used previously to make the input data file for the SEDI image (“Interpolate – Make input file – Database”) will not provide accumulated rainfall for a whole season. To have less work in Excel you first aggregate the dekadal values to monthly using the AMS function “Database – Calculate Aggregate”. First you do this for 2003 and then again for 2004. To make such a SEDI input file you need Excel. First you export the data from AMS to ASCII using the “Tools-Make input file from database” function. This ASCII file will be imported into Excel. You will export columns for all monthly rainfall values from September 2003 up to January 2004. You see the following screen: AgroMetShell Manual, August 2004 2 First you have to add the longitude and the latitude. Double click on “Station parameters” and add longitude and latitude: Now add rainfall data for all the months in the season. First double-click the right part of the tree on the left side: Then specify which month column to add and which appropriate title to use as a heading: AgroMetShell Manual, August 2004 3 In the same way you add all 5 monthly columns for 2003 and 2004 until you have the following screen: Press “Save” and the output file is shown in the AMS viewer: AgroMetShell Manual, August 2004 4 Exit AMS and open Excel with the file you just produced. In Excel use “File-Open”. The following screen is presented: Press “Next”. Specify “Comma” Press “Finish”… AgroMetShell Manual, August 2004 5 The following screen is presented in Excel as shown in figure. First remove all stations with missing values (you cannot calculate totals for those). Create a new column at the end of the data range and calculate the totals. The following file should remain. Finally you remove some columns, because you no longer need them. Beware: Column I contains formulas, not values. Column I would fail if you would remove column D-G. Therefore, first make values in column I. Do this by selecting column I and press Ctrl-C. Then go to the menu-item “Edit-Paste Special” and set the settings as follows: AgroMetShell Manual, August 2004 6 Now remove the name column and the monthly data columns as well as the title until you have the following structure: Column A now represents the longitude, B the latitude and C the seasonal total. Save this worksheet to a comma delimited CSV file using “File-Save as” with the following settings: The input file for the interpolation is now ready. Please proceed in the same way as the previous paragraph. Due to the lack of data, estimates are not produced for a large part of the country. The final map produced looks like this: AgroMetShell Manual, August 2004 7 AgroMetShell Manual, August 2004 8 From Water Balance results to yields For Afghanistan the following steps should be taken to run the water balance as part of a crop forecasting activity: As a separate preparing activity you calculate the water balances for every year in history for which you have sufficient data, calculate the index and establish a relationship between the index and the yield data obtained from the crop assessment missions and the National Statistical Office. Then for the running season you do the following: 1. For every station in the network, establish the crops to be monitored. In Afghanistan the crops are wheat, rice and perhaps maize and barley. 2. For every station in the network establish early, average and late planting dates and corresponding cycle lengths. 3. Make separate monitoring runs for 2 crops and 3 planting dates, so in this case 6 runs. 4. Throughout the season re-calculate the water balance whenever new data are received. The water balance always calculates the predicted final index. How to analyze data that have a different geographical format Basically data come to crop forecasting officers in three different ways: 1. As point data (usually by stations). E.G. Rainfall data and other parameters (temperatures etc..) reach Kabul is this way from the field stations. The data from ISPRA are in tabular form as well… 2. By province or district (technically called polygon data). Yield data are an example of this type of data. 3. By image (technically called raster or grid data). As an example: you have images for NDVI, you have an altitude image, you have created images with AMS (e.g. SEDI) Now, you can only analyze and integrate datasets if the data are in same geographical format. So, if you want to analyze your data, select one of the three basic formats described above. The following paragraphs are an overview of these three data formats and how to get the data from other formats into the right geographic format. Analyzing information on station level Station data are easy to work with. You enter the in AMS and you can use AMS, Windisp and Excel to analyze the data. You can present the station data on a map using Windisp, AMS or ArcView. The disadvantage of working with station data is the lack of overview. There is no approximation of the parameters for areas in between the stations. However, you could work with station data as long as the analysis takes place and convert the station data into images for presentation of the results and an estimation of “what happens” in between the stations. If you have data by province or district you can convert them into point data as follows: 1. Assign values to districts and provinces. Make an image of the province/districts data with the AMS function “Tools – Assign Image Values Within Boundaries” AgroMetShell Manual, August 2004 9 2. 3. Extract values for your stations into the database with the AMS function “Database – Import - From image”. If the parameter does not exist in the database, you will have to define a new parameter in AMS using the “Database – Configure – Parameter Definitions” function. If you want to do an analysis in Excel, export the data using the AMS function “Tools – Make input file from database” or the “Database – Report” function. If you have data by image you essentially do the same: 1. Take the image and extract values for your stations into the database with the AMS function using the function “Database – Import - From image”. Again, if the parameter does not exist in the database, you will have to define a new parameter in AMS. 2. If you want to do an analysis in Excel, export the data using the AMS function “Tools – Make input file from database” or the “Database – Report” function. Analyzing information on province/district level (area averaging) For the analysis of this type of data you use AMS, Windisp and Excel. ArcView is another possibility. ArcView essentially uses this type of information (polygonal). So, if you plan to work with ArcView this is probably the preferred geographical format to bring your data in. If you have station data and you have to aggregate them to provinces and districts, you do the following: 1. Make an image of the point data using any of the functions in the AMS “Interpolate” menu. You might want to use “Interpolate – Inverse distance” or (if you have a background field related to the parameter) you can use the SEDI functions. 2. Extract average values for the districts by using the Windisp function Process – Stats – Average. This will create an ASCII file with averaged values for your parameter by district/province. 3. Now you can use your data in Excel next to other data on province district level. If you are an expert in ArcView you might join the ASCII table to an ArcView shape file. If you have images you essentially do this: 1. Extract average values for the districts by using the Windisp function Process – Stats – Average. This will create an ASCII file with averaged values for your parameter by district/province. Analyzing information on image level Analyzing information on this level has the advantage that all your (intermediate) products are highly graphical and show a country-wide picture. A disadvantage is that the information uses more hard disk space. However, the affordable huge hard disks of today make this disadvantage less important. If you have station data you can make images in just 1 step: 1. Make an image of the point data using any of the functions in the AMS “Interpolate” menu. You might want to use “Interpolate – Inverse distance” or (if you have a background field related to the parameter) you can use the SEDI functions. AgroMetShell Manual, August 2004 10 If you have data by province or district you can convert them into images with just one step: 1. Assign values to districts and provinces. Make an image of the province/districts data with the AMS function “Tools – Assign Image Values Within Boundaries” Working with images is not restricted to display only. Images can be subjected to adding, subtracting and every possible other mathematical operation using the “Tools – Image calculations with formula” function: AgroMetShell Manual, August 2004 11 AgroMetShell Manual, August 2004 12

