Representing Contributory Factors: Fishbone Diagrams and other
advertisement

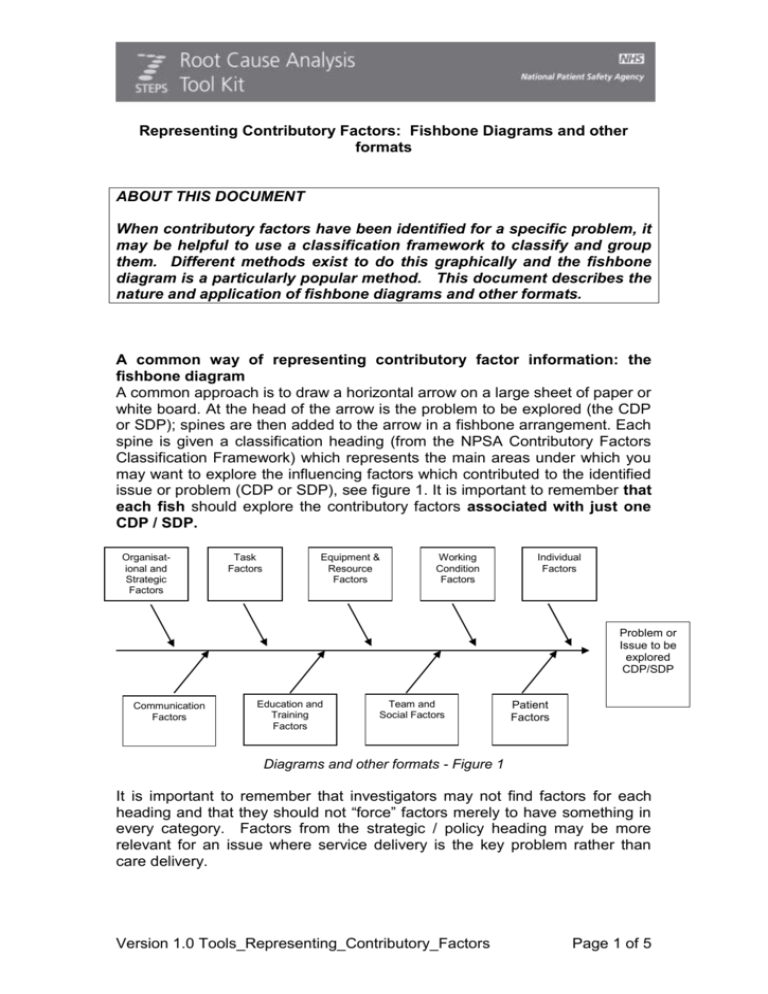
Representing Contributory Factors: Fishbone Diagrams and other formats ABOUT THIS DOCUMENT When contributory factors have been identified for a specific problem, it may be helpful to use a classification framework to classify and group them. Different methods exist to do this graphically and the fishbone diagram is a particularly popular method. This document describes the nature and application of fishbone diagrams and other formats. A common way of representing contributory factor information: the fishbone diagram A common approach is to draw a horizontal arrow on a large sheet of paper or white board. At the head of the arrow is the problem to be explored (the CDP or SDP); spines are then added to the arrow in a fishbone arrangement. Each spine is given a classification heading (from the NPSA Contributory Factors Classification Framework) which represents the main areas under which you may want to explore the influencing factors which contributed to the identified issue or problem (CDP or SDP), see figure 1. It is important to remember that each fish should explore the contributory factors associated with just one CDP / SDP. Organisational and Strategic Factors Task Factors Equipment & Resource Factors Working Condition Factors Individual Factors Problem or Issue to be explored CDP/SDP Communication Factors Education and Training Factors Team and Social Factors Patient Factors Diagrams and other formats - Figure 1 It is important to remember that investigators may not find factors for each heading and that they should not “force” factors merely to have something in every category. Factors from the strategic / policy heading may be more relevant for an issue where service delivery is the key problem rather than care delivery. Version 1.0 Tools_Representing_Contributory_Factors Page 1 of 5 Figure 2 illustrates a Care Delivery Problem from one of the case studies used in the e-Learning package and shows how the contributory factors can be categorised according to the framework. Organisational and Strategic factors Tolerance of persistent low staffing levels. Equipment and resource factors Task factors Working condition factors Individual factors Patient admitted to ward after ward round. No written guidance for who should see patients presurgery. Consultant has no fixed time for ward rounds. Delay in patient's admission to ward. SHO has limited access to senior medical advice. Ward busy - 2 patients requiring 1:1 nursing. Marking covered by sock SHO inexperienced in orthopaedics. Nurse applying sock unsure of her responsibilities. SHO unaware of procedure for marking. Communication factors Education and training factors Team and social factors Patient factors Example of a Fishbone Diagram - Figure 2 You will also find a template Fishbone to use for this type of analysis in the Resource Centre. Again, there may be different ways for presenting data during this stage of the process and the methodology and template described in the Protocol for Investigating Clinical Incidents (CRU/ALARM Protocol, Vincent et al 1999) has also been used widely within the NHS. Experience has shown that many people find that mapping the contributory factors via fishbones is a helpful tool that forces them to consider the variety of issues that can influence performance. However, not everyone likes this format - therefore it is also perfectly acceptable to consider the contributory factors either in list form under each of the relevant headings, or in tabular format. See Figure 3 for a tabular example linked to a timeline. As long as all the relevant contributory factors have been identified, it does not make a significant difference which format is used. The important thing is to use the same classification system in your analyses to ensure consistency and reliability, rather than to worry about formatting arrangements Version 1.0 Tools_Representing_Contributory_Factors Page 2 of 5 CHRONOLOGY TIME Problem/Issue CDPs/SDPs Contributory Factors: causal or influencing* Main Causal Factors (Fundamental Issues/ Roots) Recommendations Figure 3 Chronological Mapping of Problems/issues (CDPs/SDPs) and associated Contributory Factors (Taylor-Adams (2002)) You will also find a Template for the Chronological Mapping of Problems in the Resource Centre. How to Identify Contributory Factors The easiest way to identify the contributory factors for each problem identified when you are a novice is to consider each classification heading in turn and identify whether or not there were any issues or influences that map under it. The NPSA classification system can therefore be used in checklist format to facilitate this process. Brainstorming can help a group identify all the relevant contributory factors, but if this is being undertaken in a group where there are sensitivities then the brain-writing technique can easily be applied. Indeed, if time is tight, this approach can be a distinct advantage as it keeps the group very focused. As previously mentioned, both the positive and the negative contributory factors associated with a Problem/Issue (CDP/SDP) should be identified. We Version 1.0 Tools_Representing_Contributory_Factors Page 3 of 5 normally suggest using different colours, or placing a + next to the positive factors. Verification of contributory factors is an important component in the causal analysis process. It is tempting when investigating a case to use it as an opportunity to identify all the issues that you know have influenced this case or similar cases in the past. It is therefore essential that all contributory or causal factors identified are verified as being significant to the problem/issue (CDP/SDP) being analysed. Failure to do this will lead to a reduction in the credibility of the analysis. Failure to authenticate your causal data may lead the investigation team/RCA participants to focus on an improvement strategy which does not address the fundamental causes of the incident and therefore leaves the department and organisation open to the possibility of a similar incident occurring in the future, Dineen 2002. Positive Attributes of Causal Analysis using a Contributory Factor Classification System and Fishbone Diagrams it provides a structured and semi-comprehensive system for considering those influences on performance in an incident fishbone diagrams are easily constructed and understood by the novice investigator it allows more reliable improvement strategies to be developed, as they are based on verified causal information. Negative Attributes of Causal Analysis using a Contributory Factor Classification System and Fishbone Diagrams contributory classification systems have not been formally validated, the data which has not been verified may lead to inappropriate improvement strategies being implemented not all investigators feel comfortable with the fishbone diagram format. *Influencing Factors An influencing factor is something that influenced the occurrence of, or outcome of an incident. Generally speaking the incident may have occurred in any event, and the removal of the influence may not prevent incident recurrence but will generally improve the safety of the care system *Causal Factors A causal factor is something that led directly to an incident. Removal of these factors will either prevent, or reduce the chances of a similar type of incident from happening in similar circumstances in the future. Causative factors tend to be more closely related to the incident being analysed. References Dineen M., Six Steps to Root Cause Analysis. Consequence. (Oxford,2002, ISBN 0-9544328-0-0) Version 1.0 Tools_Representing_Contributory_Factors Page 4 of 5 Taylor-Adams S.E., (2002) Long Version of the CRU/ALARM Protocol. (In Press, 2002) Vincent, C., Taylor-Adams, S.E., Stanhope, N. (1998). Framework for analysis risk and safety in clinical medicine, (British Medical Journal, 1998) pp.316, 1154-7. Vincent C.A, Adams S, Hewett D, Chapman J et al,. A Protocol for the Investigation and Analysis of Clinical Incidents. Clinical Risk Unit in association with the Association of Litigation and Risk Managers (Royal Society of Medicine Press Ltd, 1999) Version 1.0 Tools_Representing_Contributory_Factors Page 5 of 5


