Anatomy of a hash join – xmp_mon output
advertisement
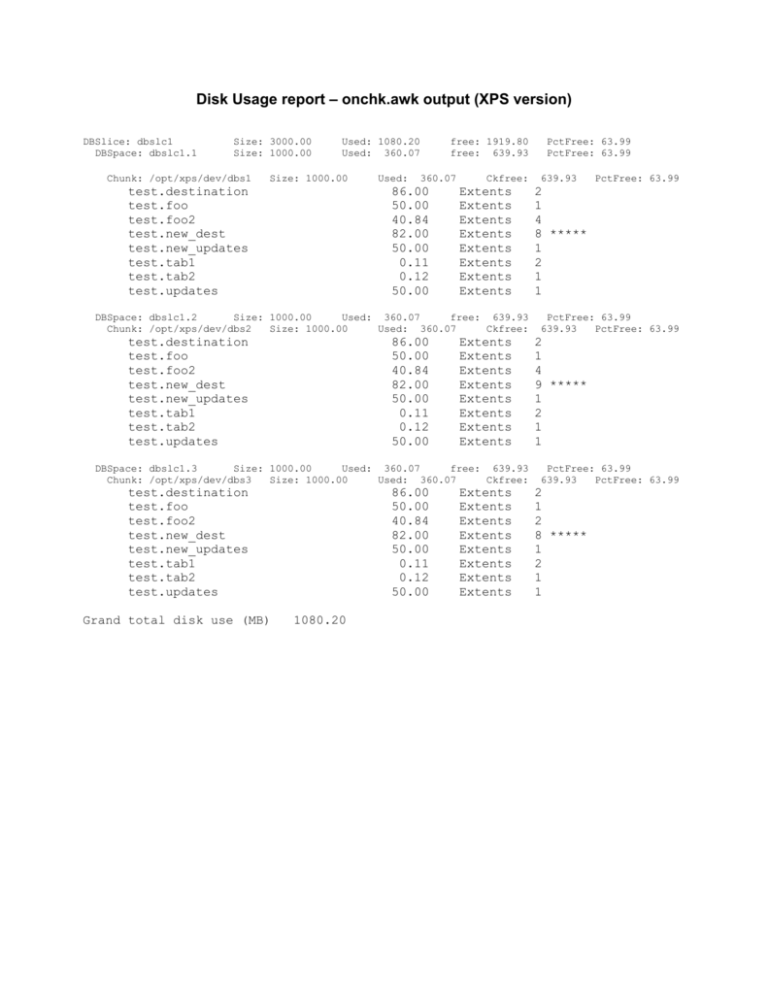
Disk Usage report – onchk.awk output (XPS version) DBSlice: dbslc1 DBSpace: dbslc1.1 Size: 3000.00 Size: 1000.00 Chunk: /opt/xps/dev/dbs1 Used: 1080.20 Used: 360.07 Size: 1000.00 test.destination test.foo test.foo2 test.new_dest test.new_updates test.tab1 test.tab2 test.updates Used: free: 1919.80 free: 639.93 360.07 86.00 50.00 40.84 82.00 50.00 0.11 0.12 50.00 Ckfree: Extents Extents Extents Extents Extents Extents Extents Extents DBSpace: dbslc1.2 Size: 1000.00 Used: 360.07 free: 639.93 Chunk: /opt/xps/dev/dbs2 Size: 1000.00 Used: 360.07 Ckfree: test.destination test.foo test.foo2 test.new_dest test.new_updates test.tab1 test.tab2 test.updates 86.00 50.00 40.84 82.00 50.00 0.11 0.12 50.00 Extents Extents Extents Extents Extents Extents Extents Extents DBSpace: dbslc1.3 Size: 1000.00 Used: 360.07 free: 639.93 Chunk: /opt/xps/dev/dbs3 Size: 1000.00 Used: 360.07 Ckfree: test.destination test.foo test.foo2 test.new_dest test.new_updates test.tab1 test.tab2 test.updates Grand total disk use (MB) 86.00 50.00 40.84 82.00 50.00 0.11 0.12 50.00 1080.20 Extents Extents Extents Extents Extents Extents Extents Extents PctFree: 63.99 PctFree: 63.99 639.93 PctFree: 63.99 2 1 4 8 ***** 1 2 1 1 PctFree: 63.99 639.93 PctFree: 63.99 2 1 4 9 ***** 1 2 1 1 PctFree: 63.99 639.93 PctFree: 63.99 2 1 2 8 ***** 1 2 1 1 Anatomy of a Table – oncheck –pt database:table output TBLspace Report for stores_demo:informix.catalog Physical Address Creation date TBLspace Flags Maximum row size Number of special columns Number of keys Number of extents Current serial value First extent size Next extent size Number of pages allocated Number of pages used Number of data pages Number of rows Partition partnum Partition lockid Extents Logical Page 0 8 1000a8 09/25/2001 12:43:24 d01 Page Locking TBLspace contains VARCHARS TBLspace contains TBLspace BLOBs TBLspace use 4 bit bit-maps 377 3 0 2 10075 8 8 16 15 9 74 1048731 1048731 Physical Page 10213f 10214f Size 8 8 Index 108_21 fragment in DBspace rootdbs Physical Address 1000a9 Creation date 09/25/2001 12:43:24 TBLspace Flags 801 Page Locking TBLspace use 4 bit bit-maps Maximum row size 377 Number of special columns 0 Number of keys 1 Number of extents 1 Current serial value 1 First extent size 4 Next extent size 4 Number of pages allocated 4 Number of pages used 2 Number of data pages 0 Number of rows 0 Partition partnum 1048732 Partition lockid 1048731 Extents Logical Page Physical Page Size 0 102147 4 Index 108_22 fragment in DBspace rootdbs Physical Address 1000aa Creation date 09/25/2001 12:43:24 TBLspace Flags 801 Page Locking TBLspace use 4 bit bit-maps Maximum row size 377 Number of special columns Number of keys Number of extents Current serial value First extent size Next extent size Number of pages allocated Number of pages used Number of data pages Number of rows Partition partnum Partition lockid Extents Logical Page 0 0 1 1 1 4 4 4 2 0 0 1048733 1048731 Physical Page 10214b Size 4 Anatomy of a hash join – xmp_mon output ===Sun Aug 26 21:48:28 EDT 2001============================ =================================================== User: informix Isolation: test PDQ: 100.00-100.00 Plan: 32 Actual Memory: 64000 (100%) Scheduling level : 50 Current SQL statement : select destination.key_col from destination, updates where destination.key_col=updates.key_col into temp t1 with no log scan 4 destination Operation scan xchg scan hjoin 3 2 Threads 3 3 3 Operation xchg flxins Phase next open Phase next Threads 1 Rows 1094059 1093652 399918 399918 updates Rows 1093652 1 Memory allocated to this query is 64MB (100%) – this is running on a Linux box Plan for the query is to scan the smaller of the two tables (3 - updates) which is complete. Then scan the larger of the two tables (destination), and probe the hash join table with that data. Anything coming out of the hash join will be used in the flxins (flexible insert) portion to write to out temp table. The scan of the smaller table is complete – read ~400K rows That data has been used to build a table in the hash join section. The larger table is currently being read – at present is up to 1 million rows Almost all of those 1 million rows have been pushed through the exchange threads into the hash join thread – which aside from receiving the data is not presently active. There are three scan threads for each of the tables. There is one active exchange iterator thread for the hash join.
