Word Doc.
advertisement
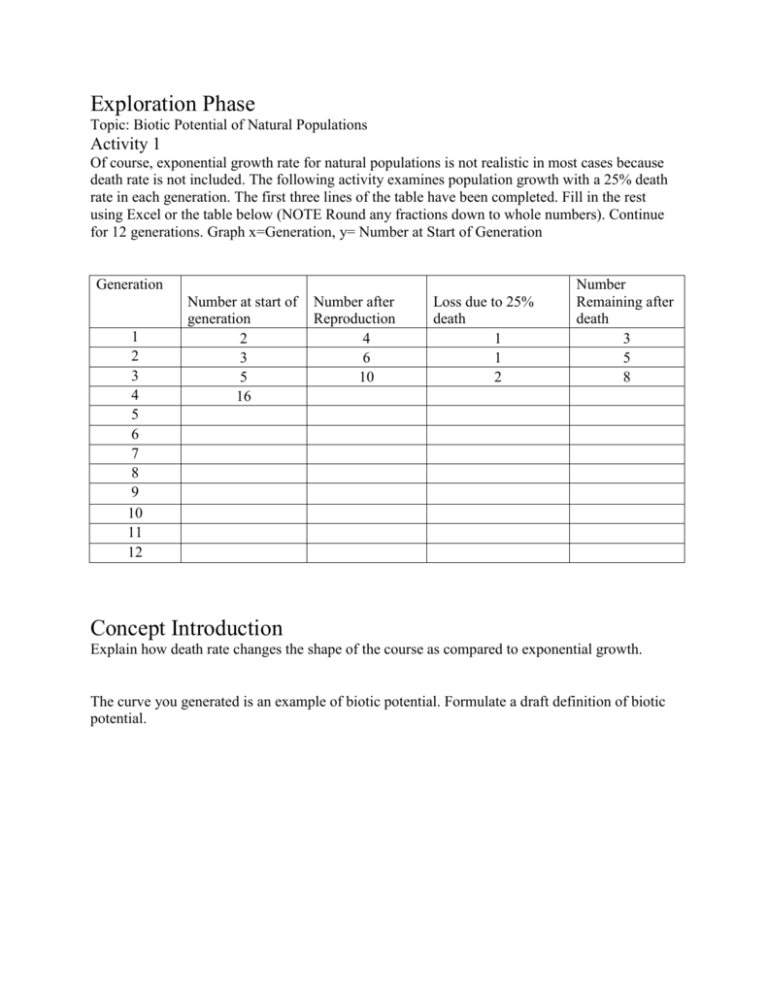
Exploration Phase Topic: Biotic Potential of Natural Populations Activity 1 Of course, exponential growth rate for natural populations is not realistic in most cases because death rate is not included. The following activity examines population growth with a 25% death rate in each generation. The first three lines of the table have been completed. Fill in the rest using Excel or the table below (NOTE Round any fractions down to whole numbers). Continue for 12 generations. Graph x=Generation, y= Number at Start of Generation Generation 1 2 3 4 5 6 7 8 9 10 11 12 Number at start of generation 2 3 5 16 Number after Reproduction 4 6 10 Loss due to 25% death 1 1 2 Number Remaining after death 3 5 8 Concept Introduction Explain how death rate changes the shape of the course as compared to exponential growth. The curve you generated is an example of biotic potential. Formulate a draft definition of biotic potential. Application HUMAN BIOTIC POTENTIAL? Year Millions of Humans Activity 1 -10000 1 Of course humans die. Are humans undergoing biotic -5000 5 growth? Enter the data into an Excel spreadsheet and graph -4000 7 it, or use the graph paper at the end. [The data was cut and -3000 14 pasted from two different locations on the US census -2000 27 website.* http://www.census.gov Historical Estimates of -1000 50 World Population] 1 170 500 190 Human Biotic Potential Line Graph y=population (millions) x=years 1000 254 1500 425 1600 545 1700 600 1800 813 1900 1,550 1950 2,400 1960 3,039 1970 3,708 1980 4,454 1990 5,284 2000 6,085 2010 6,812 2020 7,510 2030 8,111 2040 8,623 2050 9,050 Projections based on current trends. Describe the human population growth graph. Use the term "Biotic Potential" in the description. Activity 2 "Unlike plagues of the dark ages or contemporary diseases we do not understand, the modern plague of overpopulation is soluble by means we have discovered and with resources we possess. What is lacking is not sufficient knowledge of the solution but universal consciousness of the gravity of the problem and education of the billions who are its victims." MARTIN LUTHER KING, JR. 1929-1968 Will the earth hold 1015 people? Physically it might be able to hold 30% of 1015. Hold on—we will explore carrying capacity during the next lesson. We need to finish with biotic potential. According to the Population Institute (2006 Annual Report), global human population growth is about 1.3% annually, with virtually all the growth occurring in developing countries. In The Population Challenge: Key to Global Survival (2007), the mean average growth among the 20 most populous developing countries was reported to be 2.4% annually, with Afghanistan leading the group at almost 4%. Just for argument sake, assume the earth can physically hold 1015 people. Of course, the number of people the earth can actually support is much less. The current global population is about 6,500,000,000. How long will it take to reach about 1015 at the following global growth rates? a) 1% b) 2% c) 3% d) 4% You need to open an Excel spreadsheet for this activity. Try to solve the problem and answer the question before asking for assistant. Please do not run from the building screaming. Optional Activity A global average of 1.13 metric tons of CO2 carbon per person per year is released into the atmosphere. 1.13 metric tons of CO2 per year x 6,500,000,000 people = current annual production of carbon dioxide. Suppose we cut the global average to 0.5 metric tons of CO2 carbon per person per year. How long would it take to reach the current annual production based on current population growth rates?
