Reaction Time Lab Report: Experiment & Analysis
advertisement
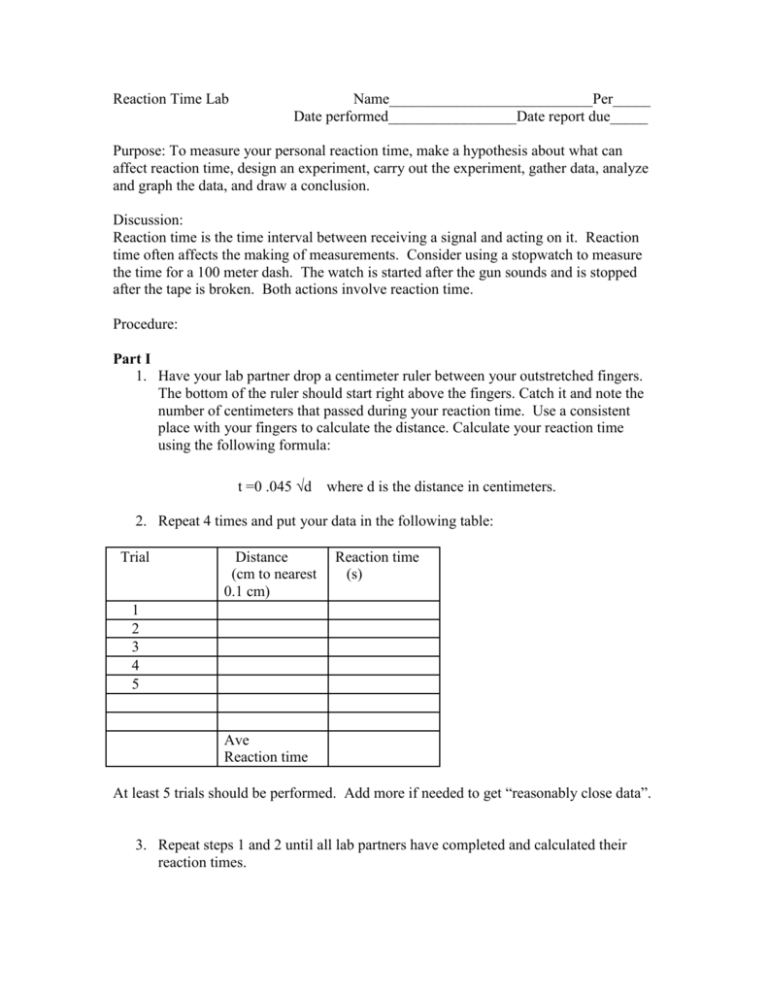
Reaction Time Lab Name___________________________Per_____ Date performed_________________Date report due_____ Purpose: To measure your personal reaction time, make a hypothesis about what can affect reaction time, design an experiment, carry out the experiment, gather data, analyze and graph the data, and draw a conclusion. Discussion: Reaction time is the time interval between receiving a signal and acting on it. Reaction time often affects the making of measurements. Consider using a stopwatch to measure the time for a 100 meter dash. The watch is started after the gun sounds and is stopped after the tape is broken. Both actions involve reaction time. Procedure: Part I 1. Have your lab partner drop a centimeter ruler between your outstretched fingers. The bottom of the ruler should start right above the fingers. Catch it and note the number of centimeters that passed during your reaction time. Use a consistent place with your fingers to calculate the distance. Calculate your reaction time using the following formula: t =0 .045 √d where d is the distance in centimeters. 2. Repeat 4 times and put your data in the following table: Trial Distance (cm to nearest 0.1 cm) Reaction time (s) 1 2 3 4 5 Ave Reaction time At least 5 trials should be performed. Add more if needed to get “reasonably close data”. 3. Repeat steps 1 and 2 until all lab partners have completed and calculated their reaction times. Part II Manipulated Variables (What can I change?) As you know, there are various outside factors that could lengthen reaction time. Brainstorm and list three. These are called manipulated variables. Hint: multiple uses of your other senses may affect your ability to do this. Equipment allowed to be used: portable electronic game, cell phones, I pod, pencil or pen in your other hand, etc. Be creative. Part III Choosing one Manipulated Variable. Pick one outside factor to test its affect on reaction time. I will perform the reaction time test while ________________. Part IV Writing a Hypothesis You need to write a hypothesis in the form of “If……, then……, because………” Your are predicting what will happen to your reaction time if you add the manipulated variable to your procedure: If I ____While trying to catch the ruler, my reaction time will_____ because ______ Part V Have your hypothesis checked by your teacher. Part VI List at least 4 variables you will control (Controlled Variables) Example: same team member drops the ruler as did it in the control experiment. Part VII Write a numbered procedure for performing your experiment. Part VIII Perform your experiment. Gather data. Calculate reaction time. Draw a data table. Perform at least 5 trials. List any notes about what occurred during the procedure that might affect your conclusion. Part IX Data Analysis Create a bar graph (use a ruler to have straight lines and linear data on the Y axis. The Y axis should start at 0. Average reaction time (responding variable) should be on the Y axis and the manipulated variable should be on the X axis. See your teacher if you need help getting started. Part X Conclusion and Support Scientists write at the end of their experiment whether their hypothesis was supported or not supported. Don’t use the words “wrong” or “right”. Example: My hypothesis, that texting on the cell phone with my left hand while trying to catch the ruler with my right hand would lengthen my reaction time, was supported by my experiment. The data from the cell phone experiment showed a 20% increase in reaction time. Write a paragraph or more in your conclusion. How does your data support your conclusion? Part XI Error Analysis Look back at the data from both the initial control experiment in Part I and the experimental data from Part VIII. Part I. Are your five data points for reaction time fairly close together? One way to analyze this mathematically is to calculate the following: Largest number in reaction time data set – smallest number in data set x 100% = ___________ % Average reaction time Part VIII Do the same calculation for the data in part VIII Largest number in reaction time data set – smallest number in data set x 100% = ___________ % Average reaction time The larger the number calculated above, the bigger the variation in the data within the experiment. Part XII Discussion Questions: 1. One student in the class gets data that shows there is a very small difference between the control experiment and the experiment with the manipulated variable. He is not sure whether is hypothesis is supported or not. What could he do to see if this difference is significant? 2. When might reaction time significantly affect measurements in sports? How might this be minimized? 3. Look back at your error analysis. What could you do to have improved your experiment? Hint: answering “nothing” is not an acceptable answer.

