CHM 235 Quantitative Analysis
advertisement
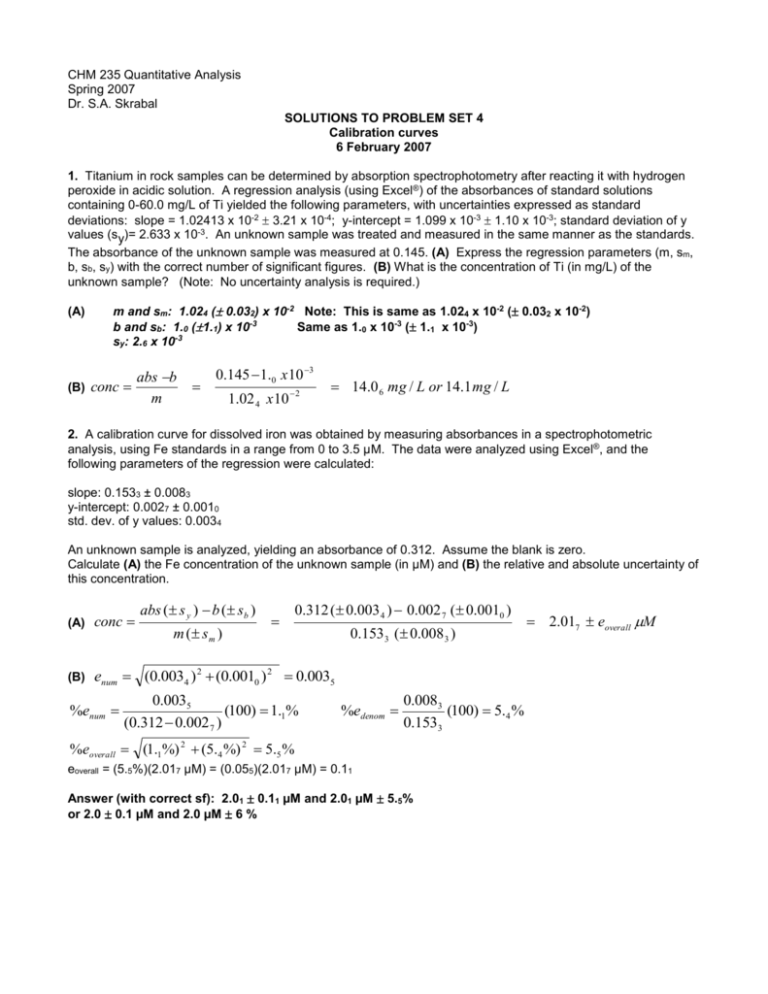
CHM 235 Quantitative Analysis Spring 2007 Dr. S.A. Skrabal SOLUTIONS TO PROBLEM SET 4 Calibration curves 6 February 2007 1. Titanium in rock samples can be determined by absorption spectrophotometry after reacting it with hydrogen peroxide in acidic solution. A regression analysis (using Excel®) of the absorbances of standard solutions containing 0-60.0 mg/L of Ti yielded the following parameters, with uncertainties expressed as standard deviations: slope = 1.02413 x 10⁻² 3.21 x 10⁻⁴; y-intercept = 1.099 x 10⁻³ 1.10 x 10⁻³; standard deviation of y values (sy)= 2.633 x 10⁻³. An unknown sample was treated and measured in the same manner as the standards. The absorbance of the unknown sample was measured at 0.145. (A) Express the regression parameters (m, sm, b, sb, sy) with the correct number of significant figures. (B) What is the concentration of Ti (in mg/L) of the unknown sample? (Note: No uncertainty analysis is required.) (A) m and sm: 1.024 ( 0.032) x 10-2 Note: This is same as 1.024 x 10⁻² ( 0.032 x 10⁻²) b and sb: 1.0 (1.1) x 10-3 Same as 1.0 x 10⁻³ ( 1.1 x 10⁻³) sy: 2.6 x 10⁻³ abs b (B) conc m 0.145 1.0 x 10 3 1.02 4 x 10 2 14.0 6 mg / L or 14.1 mg / L 2. A calibration curve for dissolved iron was obtained by measuring absorbances in a spectrophotometric analysis, using Fe standards in a range from 0 to 3.5 µM. The data were analyzed using Excel®, and the following parameters of the regression were calculated: slope: 0.1533 ± 0.0083 y-intercept: 0.0027 ± 0.0010 std. dev. of y values: 0.0034 An unknown sample is analyzed, yielding an absorbance of 0.312. Assume the blank is zero. Calculate (A) the Fe concentration of the unknown sample (in µM) and (B) the relative and absolute uncertainty of this concentration. (A) conc (B) abs ( s y ) b ( sb ) m ( s m ) 0.312 ( 0.003 4 ) 0.002 7 ( 0.0010 ) 0.1533 ( 0.008 3 ) enum (0.0034 ) 2 (0.0010 ) 2 0.0035 %enum 0.0035 (100) 1.1% (0.312 0.002 7 ) %edenom 0.0083 (100) 5.4 % 0.1533 %eoverall (1.1%) 2 (5.4 %) 2 5.5 % eoverall = (5.5%)(2.017 µM) = (0.055)(2.017 µM) = 0.11 Answer (with correct sf): 2.01 0.11 µM and 2.01 µM 5.5% or 2.0 0.1 µM and 2.0 µM 6 % 2.017 eoverall M 3. A standard curve (using enzyme standards containing 0 to 20 pg) to determine the concentration of an enzyme in biological samples gave the following results, where the uncertainties are expressed as standard deviations: slope = 0.04068 + 0.00032; y-intercept = 0.0090 + 0.0012; standard deviation of y values (sy)= 0.0069. The absorbance of an unknown sample is measured at 0.222. What is the enzyme content (in pg) of this sample, and what is the uncertainty (absolute and relative) associated with this result? pg enzyme abs ( s y ) b ( sb ) m ( s m ) 0.222 ( 0.006 9 ) 0.009 0 ( 0.0012 ) 0.0406 8 ( 0.0003 2 ) 5.235 eoverall pg enum (0.0069 ) 2 (0.0012 ) 2 0.007 0 %enum 0.007 0 (100) 3.2 % (0.222 0.009 0 ) %edenom 0.00032 (100) 0.7 8 % 0.04068 %eoverall (3.2 %) 2 (0.78 %) 2 3.2 % eoverall = (3.2%)(5.235 pg) = (0.032)(5.235 pg) = 0.16 pg Answer (with correct sf): 5.23 0.16 pg and 5.23 pg 3.2% or 5.2 0.2 pg and 5.2 pg 3 % 4. From the following data of phosphorus standards and absorbances from a colorimetric determination, (A) prepare a calibration curve; (B) find the line of best fit; (C) find the concentration of phosphorus in the unknown urine sample. You can use Excel® or a graphing calculator for this. No error analysis is necessary. P (ppm) 1.00 2.00 3.00 4.00 Urine sample Absorbance 0.204 0.411 0.614 0.821 0.455 (A) and (B) See graph below, including line of best fit, prepared using EXCEL. (C) Rearrange y = mx + b to solve for x (concentration): abs b 0.455 1.00 x 10 3 Conc 2.210 m 2.054 x 10 1 or 2.21 ppm Absorbance Phosphorus standard curve 1 y = 0.20540x - 0.00100 0.8 R2 = 0.99998 0.6 0.4 0.2 0 0 1 2 [P] (ppm) 3 4
