Life History Lab
advertisement
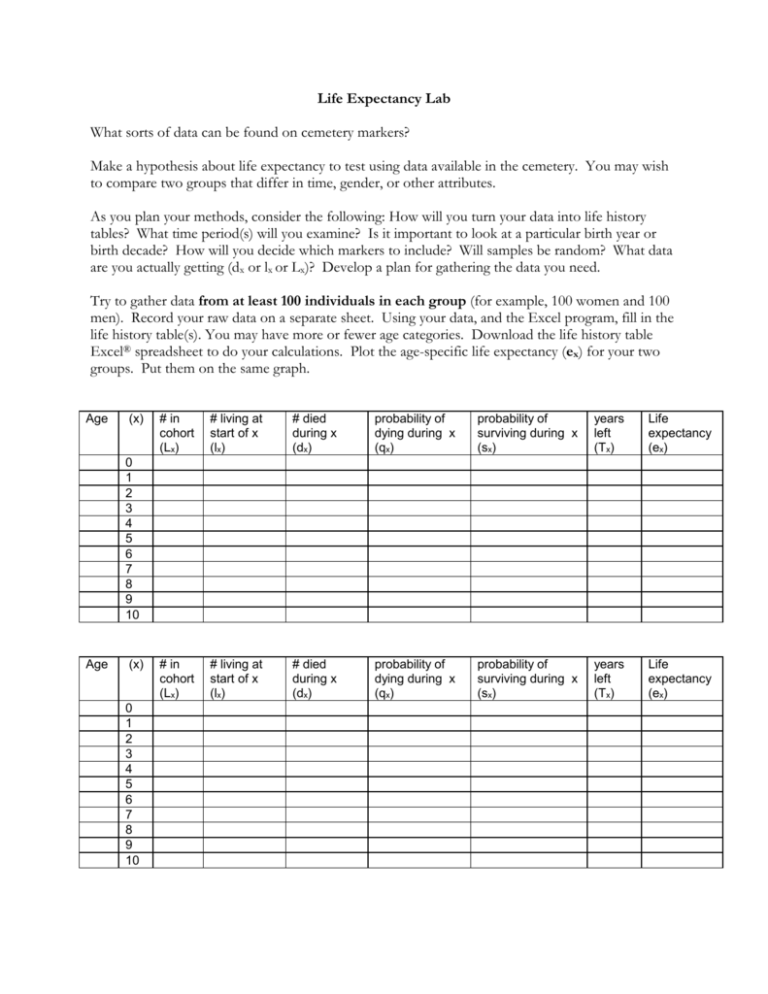
Life Expectancy Lab What sorts of data can be found on cemetery markers? Make a hypothesis about life expectancy to test using data available in the cemetery. You may wish to compare two groups that differ in time, gender, or other attributes. As you plan your methods, consider the following: How will you turn your data into life history tables? What time period(s) will you examine? Is it important to look at a particular birth year or birth decade? How will you decide which markers to include? Will samples be random? What data are you actually getting (dx or lx or Lx)? Develop a plan for gathering the data you need. Try to gather data from at least 100 individuals in each group (for example, 100 women and 100 men). Record your raw data on a separate sheet. Using your data, and the Excel program, fill in the life history table(s). You may have more or fewer age categories. Download the life history table Excel® spreadsheet to do your calculations. Plot the age-specific life expectancy (ex) for your two groups. Put them on the same graph. Age (x) # in cohort (Lx) # living at start of x (lx) # died during x (dx) probability of dying during x (qx) probability of surviving during x (sx) years left (Tx) Life expectancy (ex) # in cohort (Lx) # living at start of x (lx) # died during x (dx) probability of dying during x (qx) probability of surviving during x (sx) years left (Tx) Life expectancy (ex) 0 1 2 3 4 5 6 7 8 9 10 Age (x) 0 1 2 3 4 5 6 7 8 9 10 Instructor Notes: An Excel spreadsheet with life history table calculations can be found on the ACUBE Resources site. I recommend uploading this to your course management system for your students to use. Students will probably immediately say that they can find birth and death dates on most markers. Some might mention the ability to determine gender, ethnicity, military service, religion, family relationships, socioeconomic level, and even profession or membership in organizations (depending on the norms in your local cemeteries). This is a good opportunity to discuss assumptions and uncertainty in data. Dates are misreported. A mother’s stone may or may not say “mother.” Students may be mistaken about gender inferred from a name. Remind students that it would be important to note these issues in the discussion section of lab reports or lab notebooks. A more important issue is caused by ignoring the age of the cemetery and whether people have “had a chance to die.” I show my students a scatterplot of birth date and age at death for women religious (Fig. 1). A student collected these data in 1998 from a local cemetery. I ask them to look for any odd patterns and to try to explain them. Figure 1. Age at death as a function of year of birth for women who belonged to religious orders who are buried at Mount Olivet Cemetery, Milwaukee County, Wisconsin. Data were collected in September, 1998. At first glance, it may seem that individuals born earlier lived longer. Students recognize that this is unlikely. Most students will notice that the “edges” are very sharp. Individuals born around 1860, for example, seem to have lived to at least 65 years. Students understand that it is unlikely that life expectancy declined that quickly or regularly, but it may take a bit of guidance for them to see that the pattern is a result of the age of the cemetery. A member of the order who was born in 1840 and died at age 20 would not be in the dataset because the burials for these women at this cemetery only started in 1931. No death ages are very low, because a woman who was healthy enough to enter religious life in her late teens was apparently likely to live to at least age 30. Children would not even appear in the data. The upper boundary of the data can be explained by the date the data were collected. If a member of the order had been born in 1920, and data were collected in 1998, she would not appear in the dataset unless she were 78 years old or younger when she died. A sharp decline in the number of women entering religious orders probably explains the lack of data points for women born after 1930. This discussion alerts students to consider birth years and the age of the cemetery in their study design. You may also have a productive discussion of static vs. cohort life history tables, how life expectancies are calculated for cohorts that are still alive, and the importance of assumptions in predictive models. When students present their findings in class or in reports, they may overlook the importance of life expectancy being different at different ages unless they are prompted to discuss this. If you do not have cemeteries near campus, you can use information found online: at http://www.interment.net/ or http://academics.hamilton.edu/biology/ewilliam/cemetery/default.html.
